How to visualize hierarchical data with Flourish
From treemaps to radial trees, Flourish’s Hierarchy template makes it possible to produce five types of zoomable graphics without coding
Imagine walking into a library with thousands of books. The overwhelming expanse of information is organized into sections, genres, and authors, creating a sense of order and navigability. Hierarchical data visualization does the same with data, transforming it from a tangled web into a structured and engaging visualization.
Hierarchy charts represent data that is organized in a nested structure, depicting relationships of belonging or containment. They provide an excellent overview of the data structure, which can help understand complex systems and uncover hidden patterns and relationships in your data.
In today’s digital era, with data expanding rapidly every second, grasping the complex layers of information is not just beneficial—it’s essential.
Our Hierarchy template makes it easy to produce five beautiful types of zoomable interactive visualizations: treemaps, sunburst charts, packed circle diagrams, radial trees and drill-down bar charts.
Treemaps
A treemap represents hierarchal data with a set of nested rectangles. It has become a popular visualization style since its invention by Ben Shneiderman in the early 1990s. It works by dividing up a rectangle into tiles to show the breakdown of a dataset into its constituent parts.
The shapes are used to show a size relative to its area and each level of the hierarchy shows how categories are divided.
Compared to other proportional chart types, such as pie charts, treemaps work well for richer datasets with more data points. They are especially well suited to hierarchical data, as it’s possible to subdivide each tile into its own parts, and so on.
Packed circles and sunburst charts
Sunburst charts display hierarchy through a series of concentric circles. Each ring corresponds to a level in the hierarchy, with the innermost circle at the top of the hierarchy and the outer rings descending.
A circular treemap, also known as packed circles, is similar to a normal treemap except it uses nested circles, clearly highlighting the hierarchical relationships between groups.
Radial tree
A radial tree chart, also known as a radial dendrogram, displays hierarchical data by organizing information in a circular layout, often with a root node at the center and all other nodes branching outwards from it.
Radial trees can be visually striking and can display structures in a more compact and aesthetically pleasing manner than linear tree diagrams.
In Flourish, you can also add a bar to the end of the nodes, sized by a column in the data.
Drill-down bar charts
The bar mode in the Flourish Hierarchy template allows you to quickly create stacked bars from row-level data: the visual equivalent of a pivot table.
Compared to the other modes in the template, the bar option is ideal where you want to focus the viewer on the total value of each group – as opposed to the sunburst mode, for example, which is better for viewing proportions.
How to create and customize hierarchical visualizations in Flourish
Flourish makes it simple to create this kind of hierarchical or nested data structure by just pointing to one or more columns in a spreadsheet. There are several ways you can enhance your hierarchy chart using Flourish:
- Set how many levels of hierarchy to show at once. Hierarchical visualizations make it easy to understand parent-child relationships in the data.
- Zoom from the broadest categories down to the most detailed data points and benefit from seamless animations between layers
- Size the shapes based on numerical values in one or more columns or by the count of entries in each group
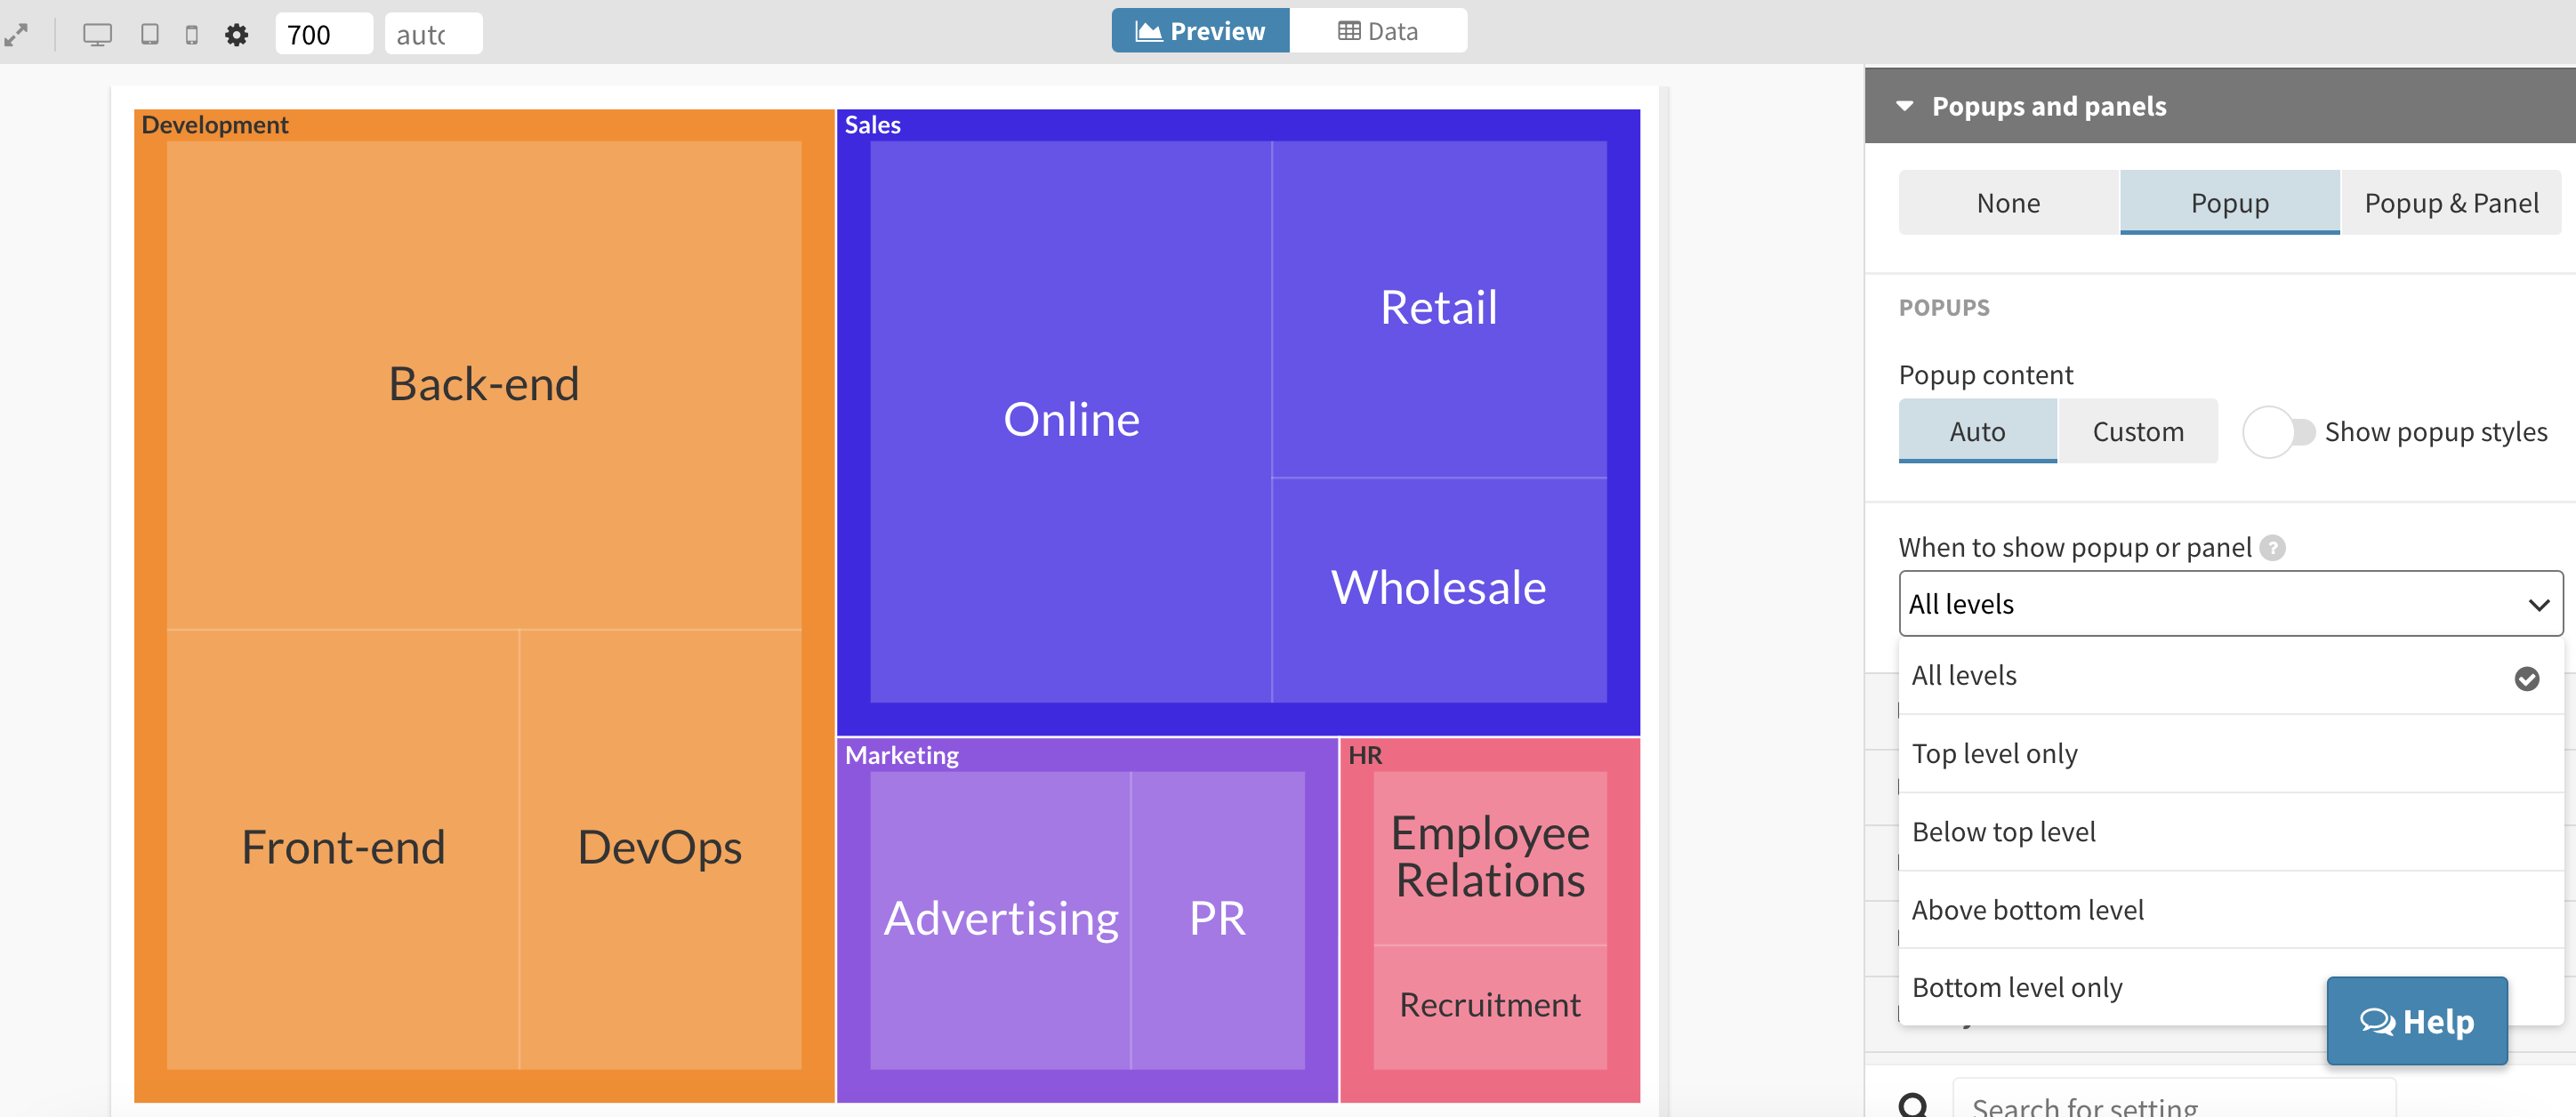
- Customize your popups and decide on which levels they should be shown
- Add a filter or time slider to your visualization, based on a column in your data
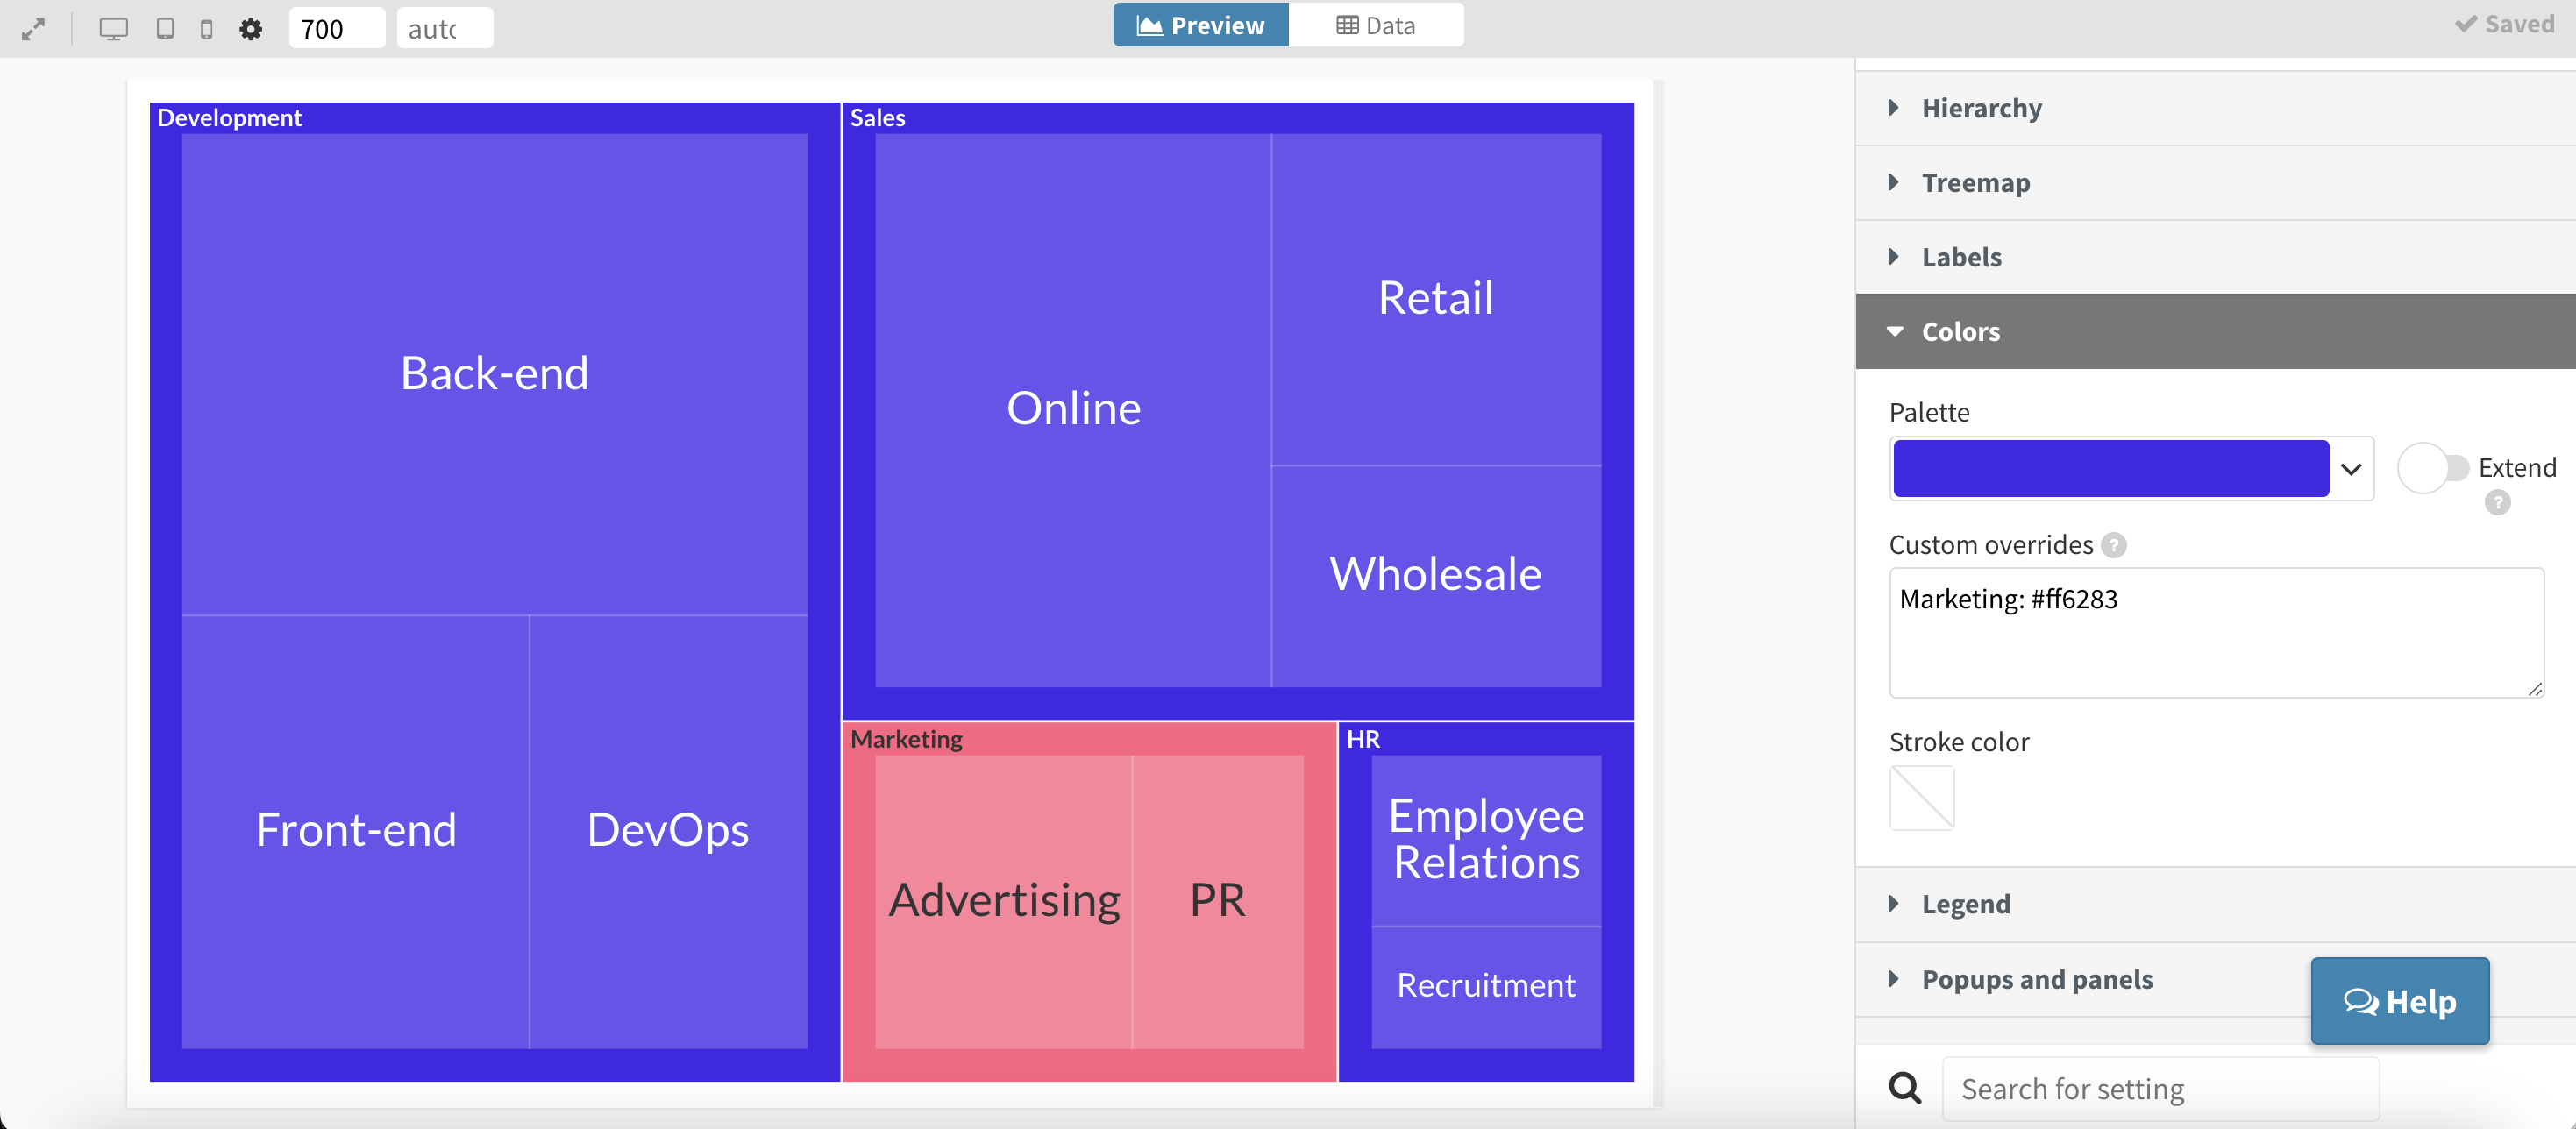
- Use the color overrides to highlight a shape
Use hierarchy charts to turn raw and bulky data sets into compelling and interactive visualizations. Engage your audience by showing in-depth information, patterns and relations between key data points.