Now you can create and publish Vega-Lite charts in Flourish
Our new template makes it easy to publish charts using Vega-Lite configuration
We’re big fans of the Vega-Lite project, which defines a syntax for transforming raw data into a wide range of visualizations. Now, with our new Flourish Vega-Lite template, it’s easy to create, publish and share any Vega-Lite visualization type in Flourish.
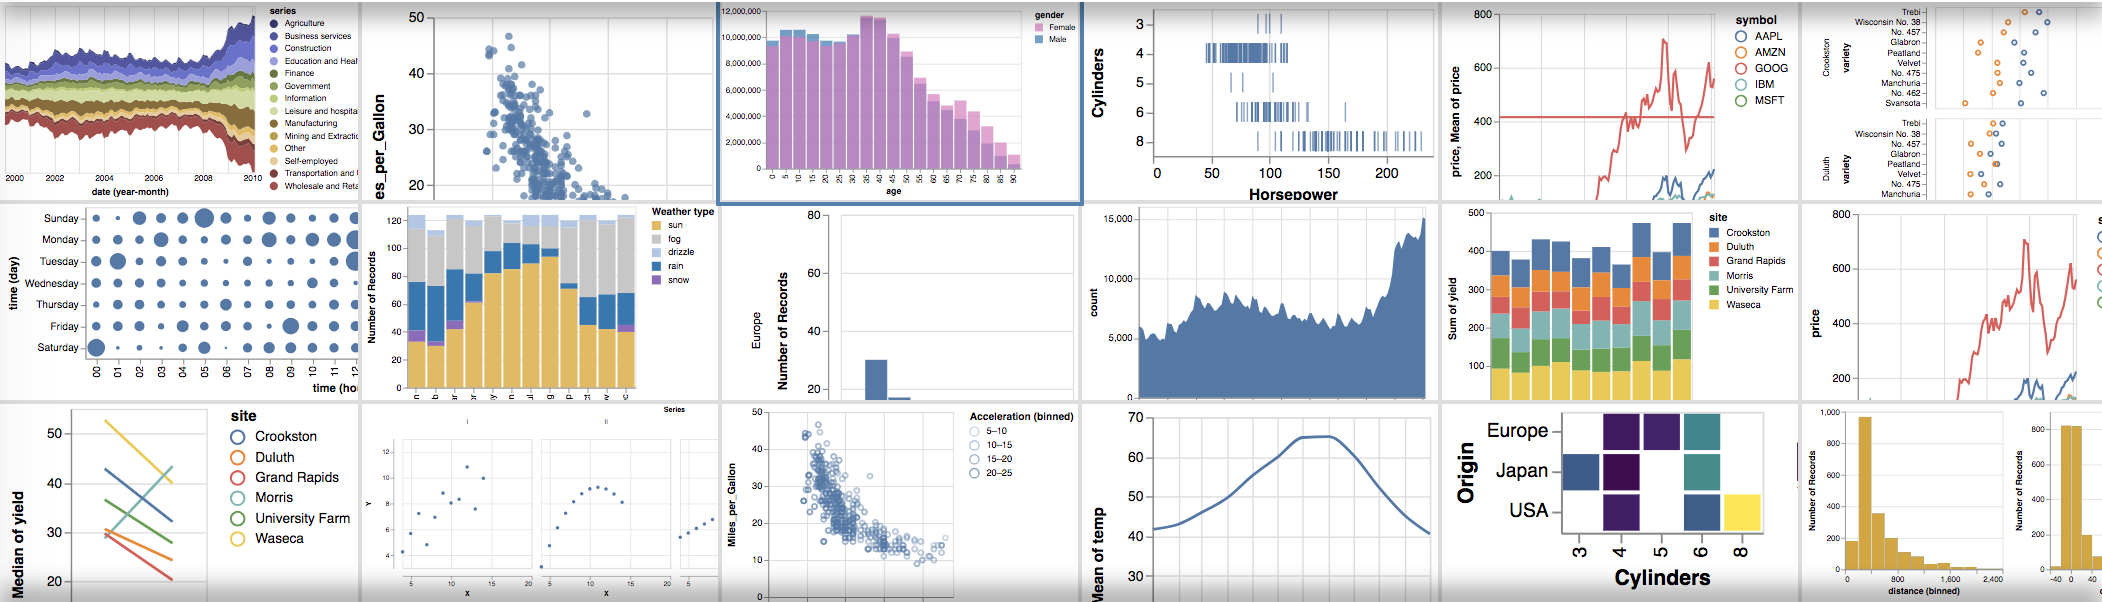
This makes it possible to create a whole new range of visualizations in Flourish, including histograms, streamgraphs, binned heatmaps, interactive “overview and detail” charts, and … well, anything else Vega-Lite can do, which is quite a lot.
Working with Vega-Lite needs you to be comfortable editing JSON, so it’s not quite the “no coding” approach that the rest of Flourish allows. But if you’re new to coding, we’d still recommend giving it a go - it could be just the place to start.
Adapting Vega-Lite examples to work in Flourish
Here’s how to make any of the Vega-Lite examples work with your own data.
- Choose the chart type you want to use on the Vega-Lite examples page
- Go to the Flourish Vega-Lite template and click “Create visualization”
- Copy and paste the configuration code into the Flourish settings panel
- Delete the
data,width,height,$schemaanddescriptionfields from the config - Upload your own data to Flourish in the usual way
- Update the
fieldsettings in the Vega-Lite configuration to match the column names in your data
The latter is the only potentially tricky bit, in visualizations that use more complex data structures. It may Just Work, but if not we recommend consulting the Vega-Lite documentation.
Here are some of the new chart types now possible in Flourish.
Histograms in Flourish and Vega-Lite
A histogram is a special bar chart that shows the distribution of values in a column of data. We often get asked if histograms are available in Flourish. The answer is now yes!
Here’s a simple example. To create this, I just uploaded a spreadsheet to Flourish in the usual way, then edited the Vega-Lite configuration in the Flourish settings panel.
This is what the JSON configuration in the template looks like. It looks complicated at first, but it’s quite simple. The mark section tells Vega-Lite to use red (#d32f2f) bars with an opacity of 0.9. The encoding section tells Vega-Lite how to process the data: the x-axis should use the “IMDB rating” column and bin the values, while the y-axis should aggregate the count within the bins.
{ |
To make a histogram with your own data, just click the button, duplicate the visualization, and upload your own data. Then edit the field setting in the x block to match your own column name.
Streamgraphs in Flourish and Vega-Lite
Here’s a slightly more complex example showing a streamgraph, which is like an area chart but vertically centered. You could use this chart type to show any kind of change over time.
And here’s the JSON config for this example:
{ |
Again, it looks complex, but just defines which fields in the data are used and how. Vega-Lite has excellent documentation to help you adapt this for your own data.
Binned heatmap in Flourish and Vega-Lite
This example shows a binned heatmap. Like a scatter plot, this chart type shows the correlation between two metrics in a dataset. But rather than plotting individual points, it “bins” the distributions – like a two-dimensional histogram.
“Overview and detail” chart in Flourish and Vega-Lite
These charts are great for time series, like stock prices. Highlight an area on the lower chart to zoom the view on the main chart.
This is an example of “brushing”, where the user can drag part of a data graphic to change the view.
We look forward to seeing what you make with Vega-Lite and Flourish! As always, if we can help, please drop us a line: support@flourish.studio