We don’t make mistakes, just happy accidents: Visualizing Bob Ross’ works
Exploring the palette and patterns of Bob Ross’ paintings through data visualization
Few artists have captured the imagination of the public quite like Bob Ross, whose iconic landscapes and soothing demeanor continue to inspire generations of artists and art lovers around the world. So when we heard about the latest data visualization challenge from Nightingale and Data is Plural all about Bob Ross, we knew that we had to submit some of our own.
First, we focused on a dataset from TwoInchBrush.com, by way of data scientist Jared Wilber, which combined each Joy of Painting episode with the names and hex codes of the colors used, as well as YouTube and image links.
To show the different colors used by Bob Ross over the years, we chose a heatmap. It displays all of Bob’s colors in rows and each episode in columns.
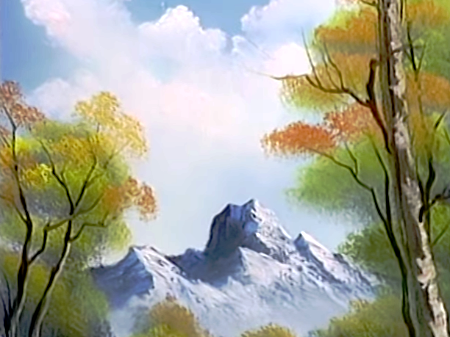
Our heatmap highlighted that Bob Ross used the color Indian Red only a single time – in this painting called Autumn Images. (Source: TwoInchBrush.com)
If the color was featured in the episode, the cell is shaded, and if not, it isn’t. This allowed us to see the fine-grained data and trends all at once, resulting in a detailed and engrossing visualization that reveals many fascinating insights. For instance, we noticed Bob used Burnt Umber a lot in earlier seasons, but Dark Sienna more often in later episodes. We also found out Indian Red was used only a single time – in season 22.
Next, we used our premium Data Explorer template to visualize the colors in Bob Ross’ paintings as bubbles for each color and animated between a bubble chart and beeswarm view.
Next, we plotted each pixel in the painting “Meadow Lake” in our Scatter template, as well as the nearest color to the one supplied in the dataset. We ended up with a variation of scatter plots and decided to animate between them to highlight the differences. We also added a version that shaded the points based on their red channel.
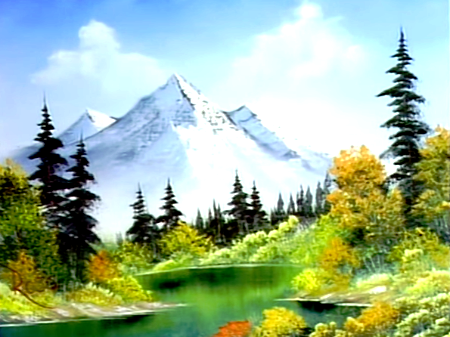
We recreated Bob's painting Meadow Lake by encoding each of its pixels into a coordinate that could be plotted onto our scatter plot. (Source: TwoInchBrush.com)
Because our Scatter template has a powerful WebGL mode, plotting some 80 thousand points is no problem.
Finally, we created a word cloud. By analyzing the frequency of words in the titles of his works, we discovered that “Mountain” and “Winter” were the two most commonly mentioned themes, reflecting Bob’s love for the natural world and his talent for capturing its beauty on canvas.
In conclusion, the data visualizations inspired by Bob Ross’ paintings offer a unique perspective on his artistic style and creative output. Through the use of heatmaps, bubbles and scatter plots and word clouds, we’ve gained insights into his color choices, painting techniques, and even the themes that he explored most often. The power of data visualization lies in its ability to reveal patterns and trends that might otherwise go unnoticed, and in this case, we’ve deepened our understanding of Bob Ross’ artistry and legacy.
Thanks to Nightingale and Jeremy Singer-Vine for this data visualization challenge as well as Jared Wilber and Walt Hickey for compiling and sharing the datasets. And to the Flourish team – Mafe, Helena, Annie, Simona, Hugh and Cale – for collaborating on this project.