A guide to creating charts and graphs for social media
Learn how to create visually appealing charts for social media using Flourish and Canva
A common belief is that creating charts is complicated and time-consuming. While this may have been the case in the past, many data visualization and design tools like Flourish and Canva now allow businesses to create stunning pieces of content without all the hassle.
But although creating and sharing data visualizations on the web has become significantly simpler over time, sharing charts and graphs on social media presents some new challenges. Is the chart readable enough on small mobile screens? Is it understandable without interactivity? Are social media users interested in data visualization at all?
Below, we answer all these questions and provide you with a handy guide on creating charts for social media. Let’s get started!
Do charts and graphs belong on social media?
In today’s fast-paced digital world, it’s essential to be able to tell a story quickly and effectively. That’s exactly what data visualization does – it’s an effective tool for better understanding and analyzing complex information, allowing users to easily identify patterns, trends, and relationships within the data. Besides, it does so in a visually appealing way that is both engaging and easy to understand.
Every December, thousands of people share their Spotify Wrapped on social media without hesitation – which is a prime example of a popular and enjoyable (although slightly unconventional) data visualization. And every day, millions of one-off data stories get shared on social, on every conceivable topic:
The hard truth is that it didn’t have to be this bad, but Donald Trump ignored the experts and refused to take action. He has failed our nation.pic.twitter.com/WAhigUtsxz
— Joe Biden (@JoeBiden) July 19, 2020
NEW: a common response to reports of hospitals struggling this winter is "it’s no different to a bad flu season!"
— John Burn-Murdoch (@jburnmurdoch) January 7, 2021
I’ve tracked down historical data on flu ICU admissions, including winter 2017-18, a record high.
Here’s how England’s Covid winter compares to a bad flu season 📹 pic.twitter.com/tsExrDZM31
Unsurprisingly, one such topic in the last few years was COVID-19. For example, US President Joe Biden used a Flourish Bar Chart Race to visualize COVID-19 cases by country, and as you can imagine, it took off pretty quickly. Meanwhile, The Financial Times’ interactive data journalist John Burn-Murdoch used a step-by-step line chart to visualize intensive care admissions in UK hospitals. (By the way, we spoke with John and recreated his chart in Flourish – take a look!)
Data has become an integral part of our lives and we’ve previously discussed why it’s so important for both users and businesses. However, the most crucial fact is that data is no longer something people fear – and consequently, marketers and journalists shouldn’t be afraid to use it to their advantage.
What are the benefits of sharing charts and graphs on social media?
Another US election, another "Land doesn't vote, people do" style map showing the election results. pic.twitter.com/XmMTSUKJof
— Simon Kuestenmacher (@simongerman600) November 11, 2022
Data visualization and especially data storytelling help to clearly and effectively communicate complex ideas or information. But what’s the point of creating them when nobody sees them?
By sharing data visualizations on social media, businesses can demonstrate their expertise and data-driven decision making to their followers, while potentially attracting new customers or partnerships. Additionally, sharing data visualizations on social media can help businesses to increase their brand visibility and reach, and even drive more traffic to their website.
Data visualization on social media also lets users engage with visualizations in a more social way, sharing their thoughts and asking questions to deepen their understanding of the insights revealed. This can be a valuable way to build and maintain relationships with your audience.
Creating charts for social media – where to start?
Social media platforms do not support interactive embeds, so you’ll have to convert your visualizations into images, videos or GIFs. But worry not, we’ve got you covered! Here are some tips on how to easily create impactful data visualization content for your social channels below – using both Flourish and Canva.
1. Choose an easy-to-read chart type
Some visualizations may look absolutely stunning but fail to actually convey a message when the main elements are difficult to read.
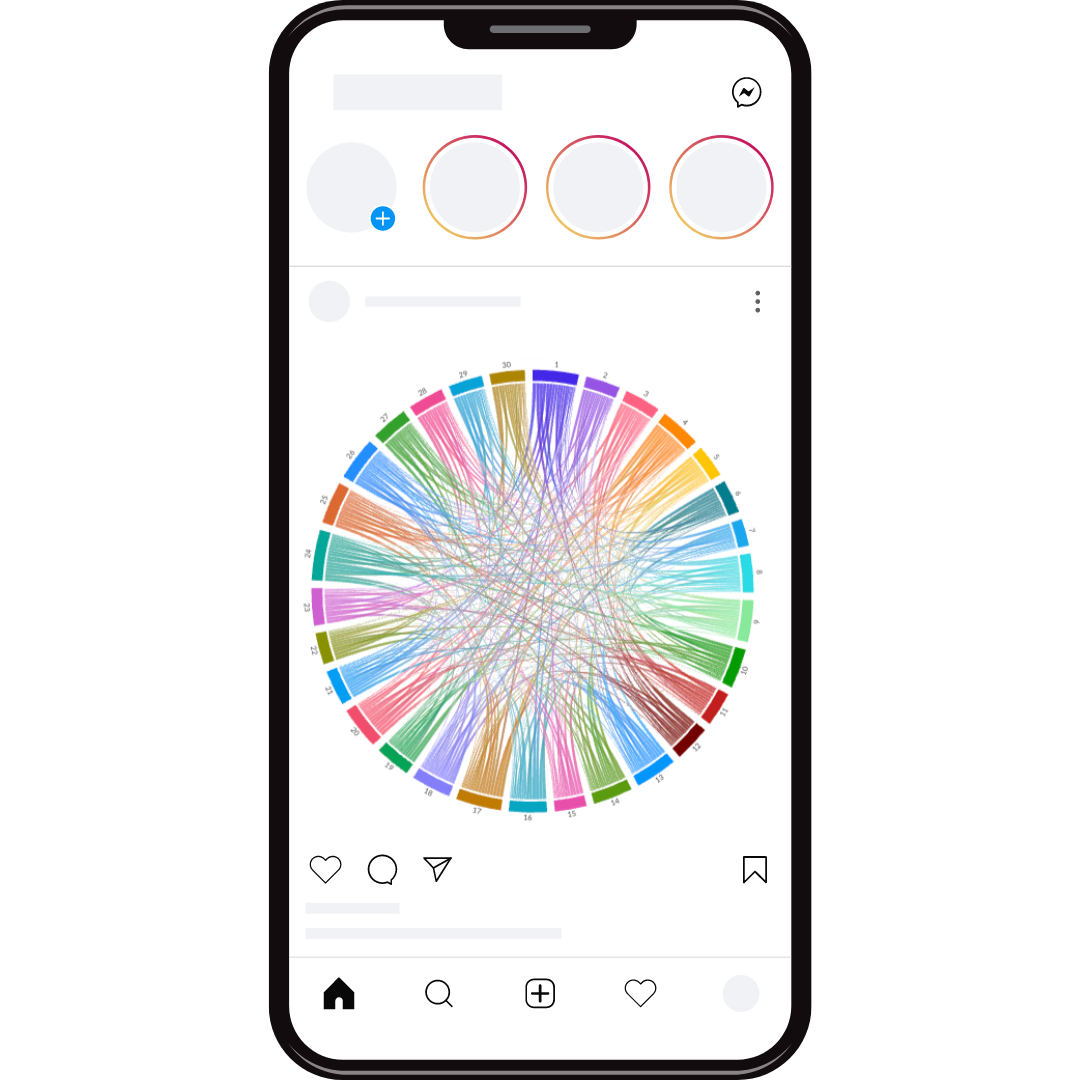
It is important to keep in mind that not every chart type is “suitable” for social media platforms. In other words, a visualization consisting of 25 grids of dozens of tiny charts or anything that requires lots of zooming may not be the best idea for a static social post.
Some charts rely heavily on interactivity to be understood and may not translate well when shared on social media. Additionally, if the labels on the chart are too small and unreadable, social media users may not be able to fully grasp the information being presented.
In order to effectively communicate data on social media, it’s best to use simpler chart types such as line charts, bar charts or maps which are easy to read and understand at a glance. Alternatively, consider annotating your social media post with additional elements, such as labels and arrows – see below.
2. Provide enough visual clues
Chart elements such as colors and labels are vital for the creation of any data visualization, and this also applies for social media storytelling. In order to convince users to stop scrolling and pay attention to your post, your chart should be captivating from the get go – and there are many ways to achieve this. See the story below for some examples.
3. Add additional elements
Adding custom graphics and enhanced chart elements can really make a difference on social media. See an example on the right and imagine it without the text, labels and arrows – how much of the story would be available then?
Here’s how we created this post:
After finalizing the Flourish charts, we added them to a Canva design and resized them accordingly. This story was specifically created for social media, so we didn’t add any headers or labels.
However, if your visualization does come with textual elements, you may notice that they are too small when added to Canva. In Flourish, increase the font size of your visualization so it looks better on smaller canvases (such as square aspect ratios). We often use the following font sizes for Instagram: 1.5 rems for headers, 1.3 for subheaders, 1.1 for axis labels and footers.
One of the biggest benefits of adding your Flourish charts to Canva is how easy it is to resize them. Increase or reduce the size of your visualization to fit any aspect ratio.
You can easily resize Flourish charts on Canva.
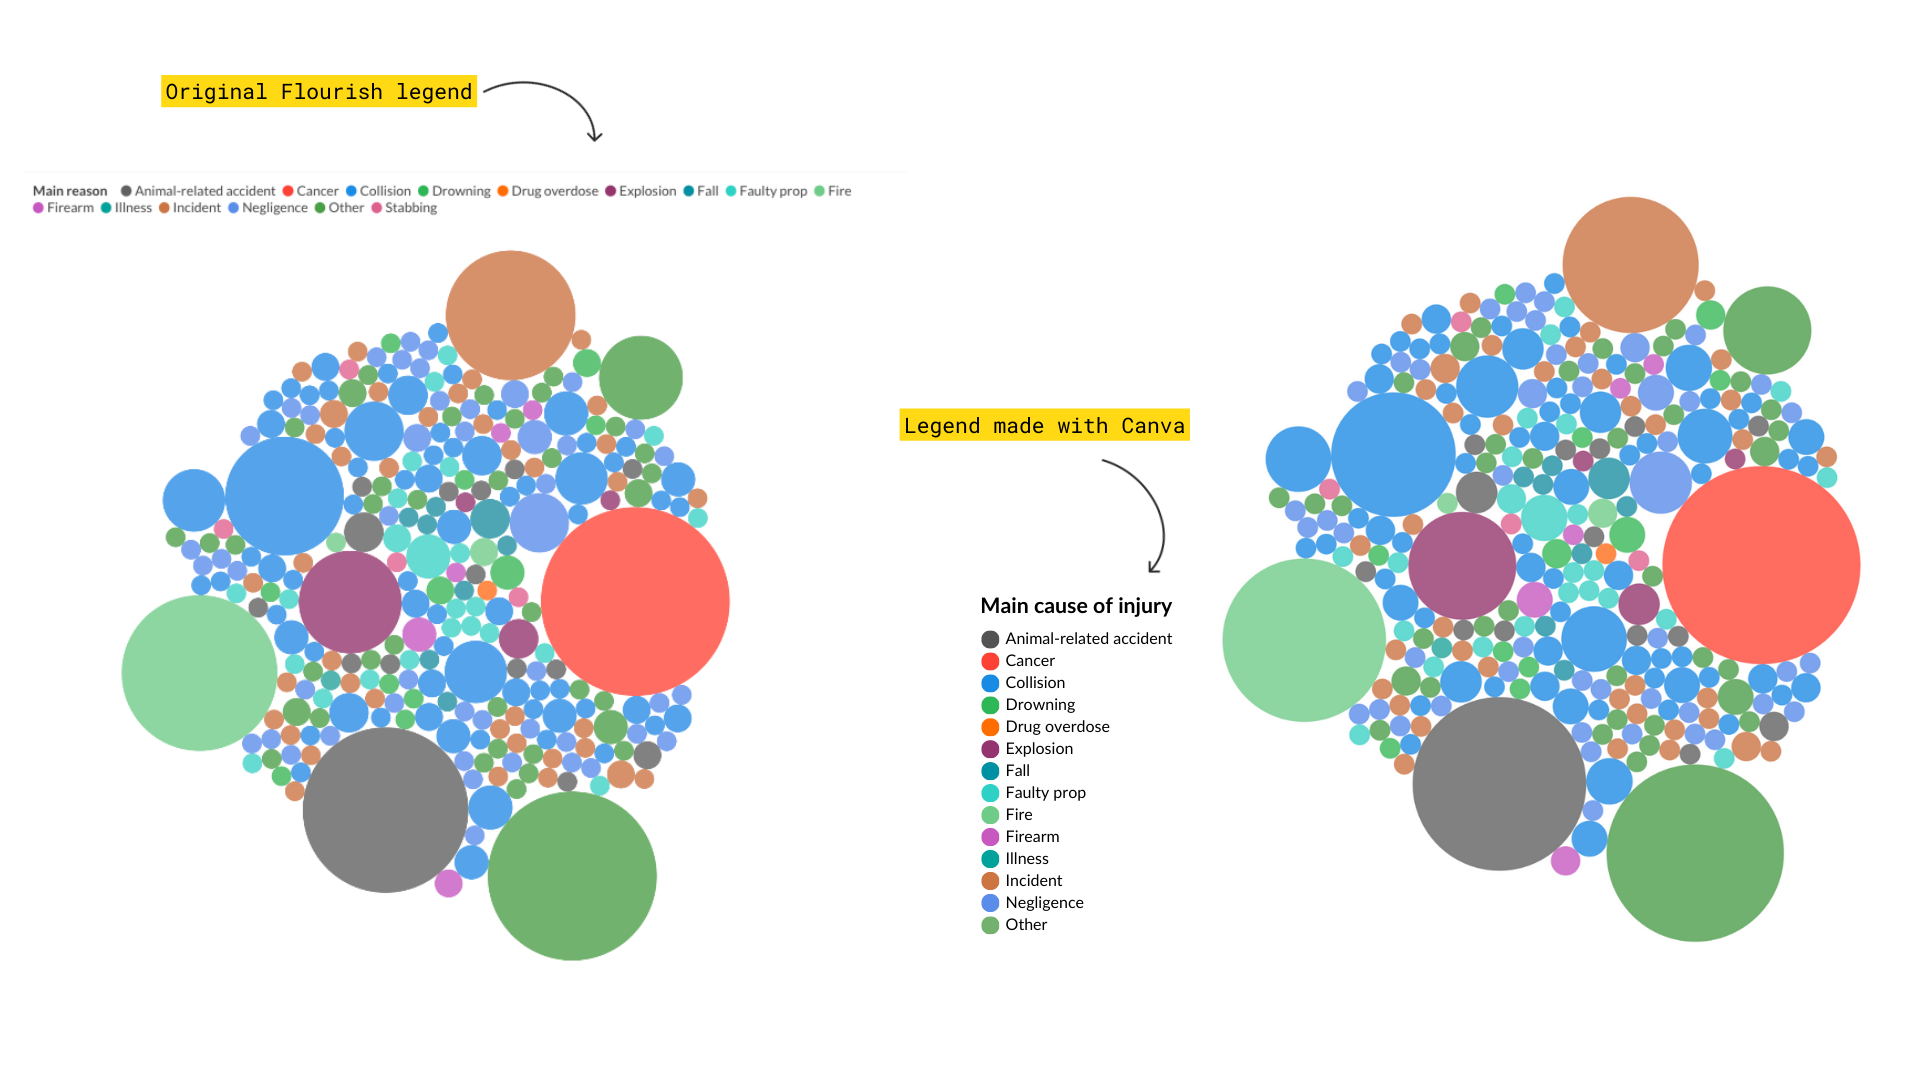
- To make use of all available space, we recreated the categorical legend of the Survey template (slide 3) in Canva, using the graphical elements available. This allowed us to maximize the space for the graph itself, while also enlarging the size of the legend, so it’s easier to read on smaller screen sizes.
- Last but not least, we added graphics (arrows) to point the user’s focus to the main parts of our story. That’s all! 🎉
While Flourish is a powerful tool on its own, its main purpose is to allow users to create interactive stories for the web. However, by using Flourish and Canva together, you can unlock the potential for new, rich visualizations, that work on any platform and in any format. See other ways to enhance your digital projects using both tools on our help page.
4. Share your charts as GIFs or videos
Need a simpler way of sharing your Flourish visualizations on social media? No problem! Sometimes, all you need is a GIF or a video alternative of your stunning interactive project.
Animated charts bring a storytelling element to your social media posts in a way that static charts cannot. Whether you share one of our racing charts, create an interactive map or use the Flourish story function to switch between different views of your visualization, the options are limitless.
You can easily turn any animated Flourish chart into a video or GIF for social media by doing a quick video screen recording. Check our help page for advice.
To summarize…
Data visualization is a powerful tool for effectively conveying a message and telling a story. Whether you’re creating charts and interactive content for a report, website, or social media platform, the ultimate goal is to present the information in a visually appealing and engaging way. However, it is important to consider the specific limitations and constraints of each platform, as they may require different approaches to effectively communicate the message.
On social media, where interactivity and formatting are often restricted and competition for attention is high, it may be necessary to get creative in order to effectively convey your message. This might involve using innovative chart types, capturing animation through GIFs or videos, or finding other ways to capture attention in a crowded and fast-paced environment. By considering the unique challenges of each platform and finding creative solutions, data visualization can be an effective way to share your story and engage your audience.
For more, watch our webinar
Want to see how we at Flourish create charts and graphs for social media? Then watch the recording of our webinar “How to master data visualization for social media” on YouTube.