Hi everyone,
Just in time for Christmas, a few little seasonal presents from Flourish HQ!
New template! Marker maps, locator maps, emoji maps, image maps…
Highlighting places or visualising point data is easier than ever with the powerful new Marker Map template. Use icons, emoji or even uploaded images to mark locations, and include an inset map or globe for context. Create simple locator maps, rich data maps or immersive animated “tours” in a Flourish story.
• Marker Maps: read the blog post
New feature: drill-down bar charts
We’ve added a new view to our Hierarchy template to allow interactive “zoomable” bar charts. Drop in raw data and the template “pivots” by whatever columns you’re interested in, instantly making a rich explorable chart that also works brilliantly in Flourish stories.
• Hierarchical bars: see an example
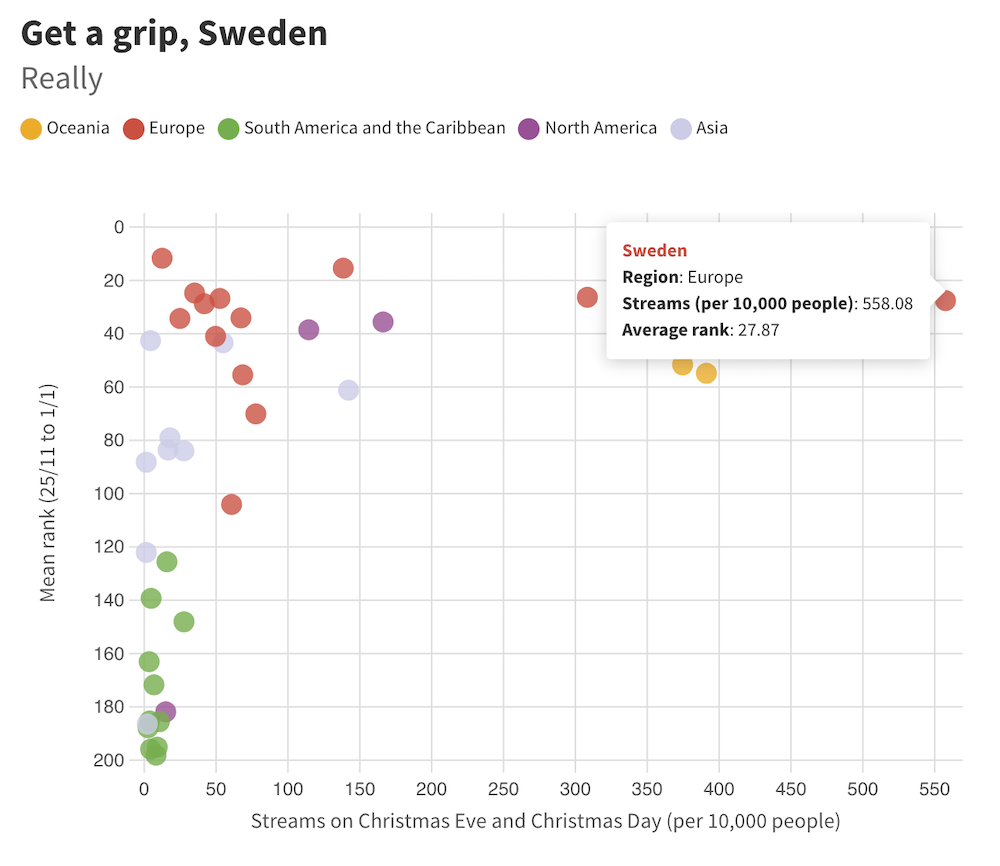
All I want for Christmas… visualizing Mariah Carey via Spotify data
Which countries jump on the Xmas bandwagon earliest each year? And which jump off last? We decided to find out by scraping global Spotify data for plays of Mariah Carey’s “All I Want for Christmas”. Cue chart titles such as “Iceland – you guys okay?”
• Global streams of Mariah Carey’s “All I Want for Christmas”
Thank you!
As 2018 draws to a close, we can hardly believe we launched Flourish this year! It’s been an amazing ride and we want to thank all of you for being part of the Flourish community as we’ve grown from nothing to, well, something. We have even bigger plans for 2019 so watch this space. In the meantime happy Christmas and new year!
Best wishes,
Duncan and the Flourish team
PS. In case you missed it last time…
• New arc maps
• Why legends suck and what to use instead
Flourish, part of the Canva family
33-35 Hoxton Square
London N1 6NN