Hi everyone,
One mega feature and a bunch of updates to share today.
“Talkies”: introducing audio-driven data graphics!
You can now add a voiceover to a Flourish story to create a “Talkie”. This is a long-planned milstone in our aim of helping our users bridge the gap between data exploration and data explanation. Like videos, Talkies can tell clear narrative stories. Unlike videos they’re interactive – not to mention responsive, higher quality and quicker to load. We can’t wait to see what Talkies you make!
• Read the blog post and make your first Talkie!
You can also use the new feature without audio to make “autoplay” stories that progress through your slides silently. These can be great for big screens at events, or to create embedded charts that loop through a few views without the viewer needing to interact.
New template features
We’ll soon be publishing significantly improved versions of many of the built-in Flourish templates. In the meantime, a few new features:
• The Survey template now offers various shapes, such as the squares in the Talkie example above.
• The Scatter template now has rotatable axis labels.
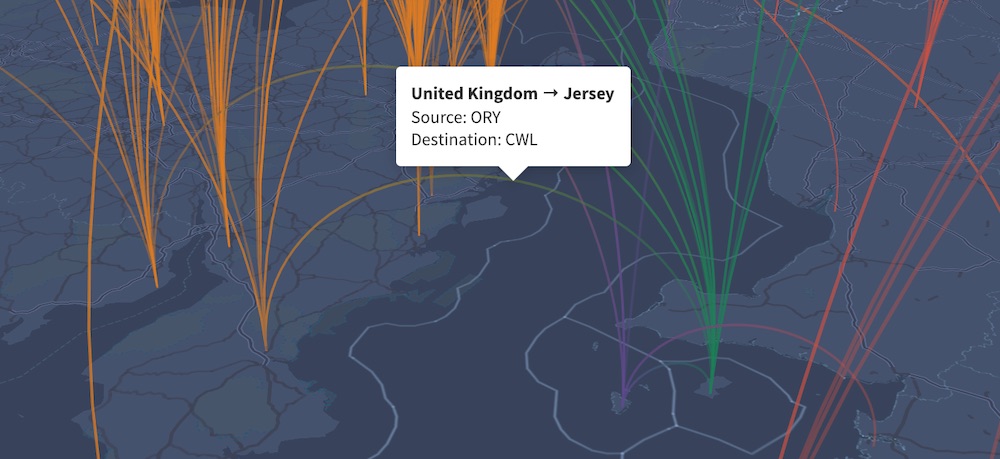
• The Arc map template now includes controls (menus, time sliders) and popups.
Template versioning
We’ve launched a sophisticated new versioning system for Flourish templates. This allows Flourish developers (including our team) to more easily fix bugs and add features in a way that maximises compatibly with existing projects. Developers can read the details here.
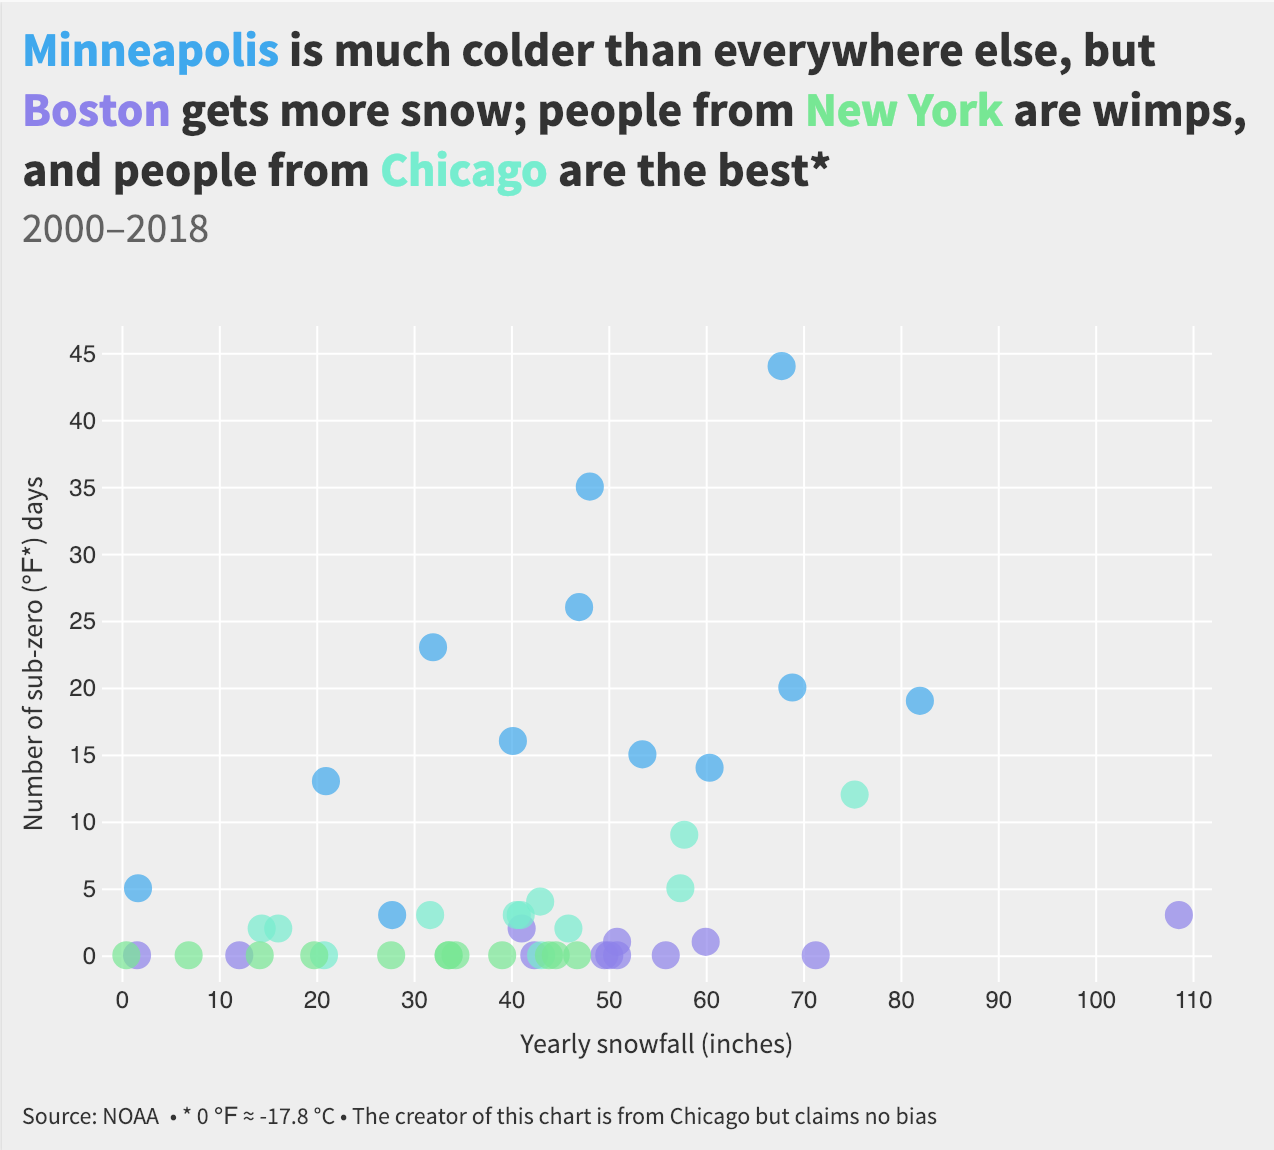
On the blog: making sense of the polar vortex
Our in-house data journalist Katie Riley had a look at the big freeze currently dominating the US, and visualized the results.
• Which US city has the worst weather
We’ve got a whole bunch of exciting things to launch in the next few weeks, so we’ll be back soon! In the meantime, as always, just press reply with any thoughts, feedback and ideas.
Best wishes,
Duncan and the Flourish team
PS. In case you missed it last time…
• Marker maps, icon maps, locator maps
• Introducing drill-down bar charts
• All I want for Christmas is data
Flourish, part of the Canva family
33-35 Hoxton Square
London N1 6NN