Hi everyone,
We hope you all had a great summer. We have a stack of updates to share, so here goes…
Flourish’s secret scrollytelling feature!
Many of the coolest visualization projects these days use “scrollytelling”, where graphics animate as a reader scrolls down the page. It’s now possible for anyone with a little bit of JavaScript knowledge to do scrollytelling with Flourish stories, as Sky News demonstrated recently. (We plan to release a completely zero-coding version in due course.)
• Scrollytelling blogpost and Sky Q&A
New feature: arrow plots
You can now add arrows on our super-flexible Scatter template. “Arrow plots” are great for highlighting the change over time for one or more data points. And, this being Flourish, the arrows are animated and mobile-friendly.
• Arrow plots: read the blog post
Improved settings panels
We’ve improved the design of the settings in the Flourish visualisation editor to make things cleaner and clearer.
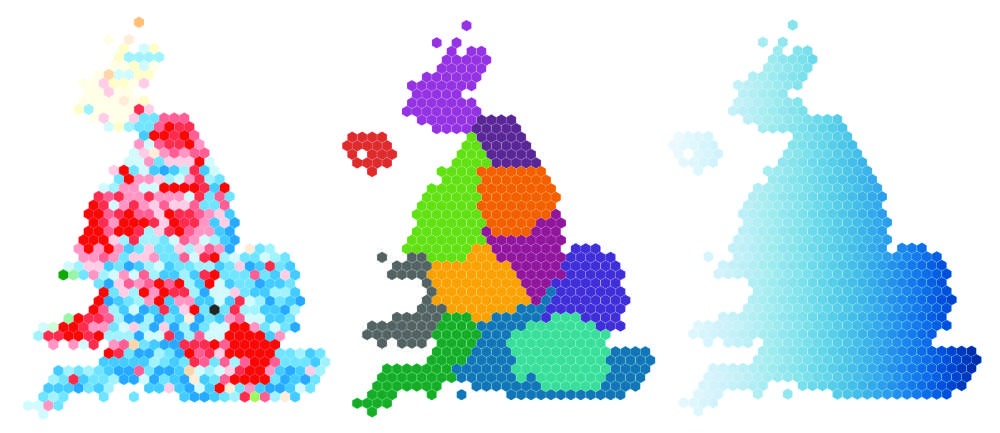
Hex maps and election data
Journalist users in the UK will be covering an election soon, so now is a great time to read Katie’s blog post from April on visualizing election data. We’ve also added an example hexagon map for UK constituencies, which you can use with your own data. If it would be useful to have a blog on hex maps soon let us know!
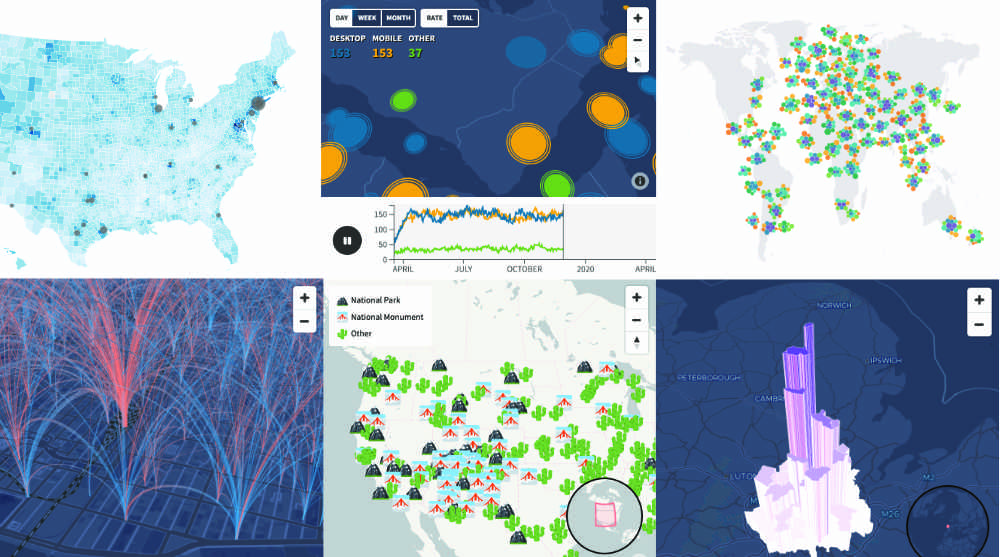
So many maps
Marker maps, arc maps, dot maps, projected maps, survey maps, hex maps … Flourish now has so many map templates that we thought we’d put them all on one page so you can take stock and see which would be best for your next project with geographic data.
Lots of small improvements
There are too many small improvements to list in full, but here are a few much-requested changes:
• Paying users can now see their invoices on their account page.
• You can remove/configure the “All” option when filtering scatter plots.
• In the Hierarchy template you can now select multiple value columns to create a menu.
• Better and more flexible legends in most templates.
Welcome Luisa!
We’re delighted to welcome Luisa Bider to the Flourish team. Luisa will be handling user support queries and improving our help resources. Let her know via support@flourish.studio if you’d like to see help articles on any specific areas.
That’s probably enough for one newsletter, but we’ll be back in touch in a couple of weeks with updates about a bunch of new templates and features that are currently in beta.
As always, we’d love to hear your feedback or ideas. Just hit reply!
Best wishes,
Duncan and the Flourish team
PS. In case you missed it last time…
• Introducing the “Line Chart Race template
• Animated Sankey diagrams
• Monochrome colouring now available on our base maps
• Timed caption feature on the bar chart race template
• Styling and popups now availalbe in the table template
• Much-improved bar chart labels
Flourish, part of the Canva family
33-35 Hoxton Square
London N1 6NN