Hi everyone,
Thanks for all the feedback since the last update. Here are two more exciting Flourish visualization templates that you can make use of from today…
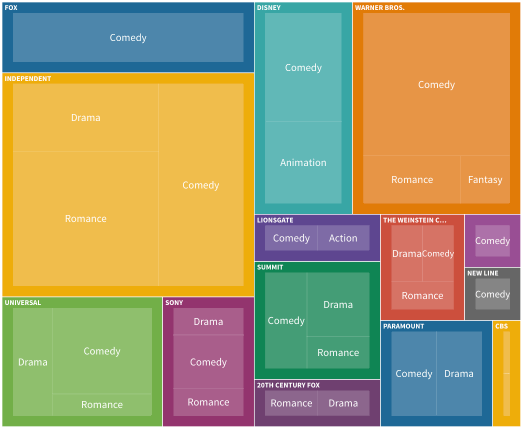
Animated treemaps
Treemaps are great for visualizing hierarchical data, but they are hard to do well. Our new template makes it easy to turn a spreadsheet into a fully responsive treemap with auto-scaling text, popups, filters and – best of all – hierarchical animated navigation.
Vega-Lite + Flourish = 💪
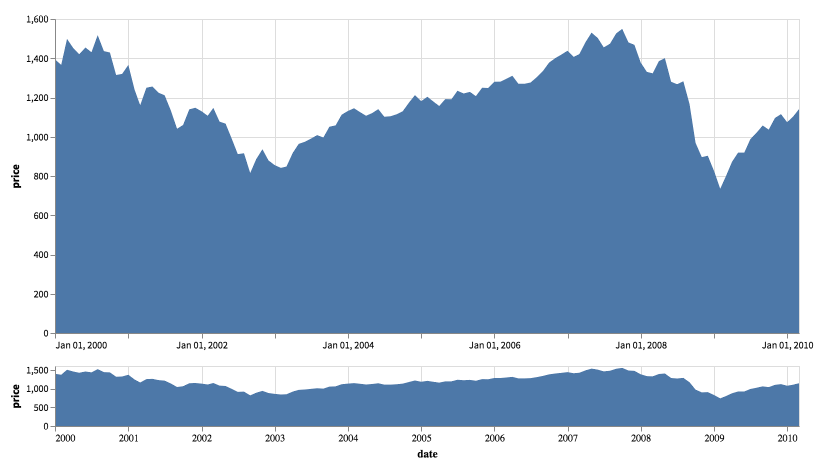
We've also just launched a template for making Vega-Lite charts in Flourish.
Vega-Lite is a powerful charting tool that lets you build dozens of visualization types by editing simple configuration code (think of this template as being suitable for "semi-coders"). You can use the new Vega-Lite template to create histograms, streamgraphs, interactive detail charts (like below) and much more.
• Read the blog post: Vega-Lite charts in Flourish
• Try it now: Make a streamgraph
That's enough for now, but we'll unveil some more templates and features in a couple of weeks. As usual, hit reply with any suggestions, feedback or feature ideas!
Best wishes,
Duncan, Robin and the Flourish team
Flourish, part of Canva
G06, 16 Baldwin’s Gardens, London EC1N 7RJ
Flourish, part of the Canva family
33-35 Hoxton Square
London N1 6NN