Hi everyone,
This month, we’re excited to share two big developments and lots of smaller ones!
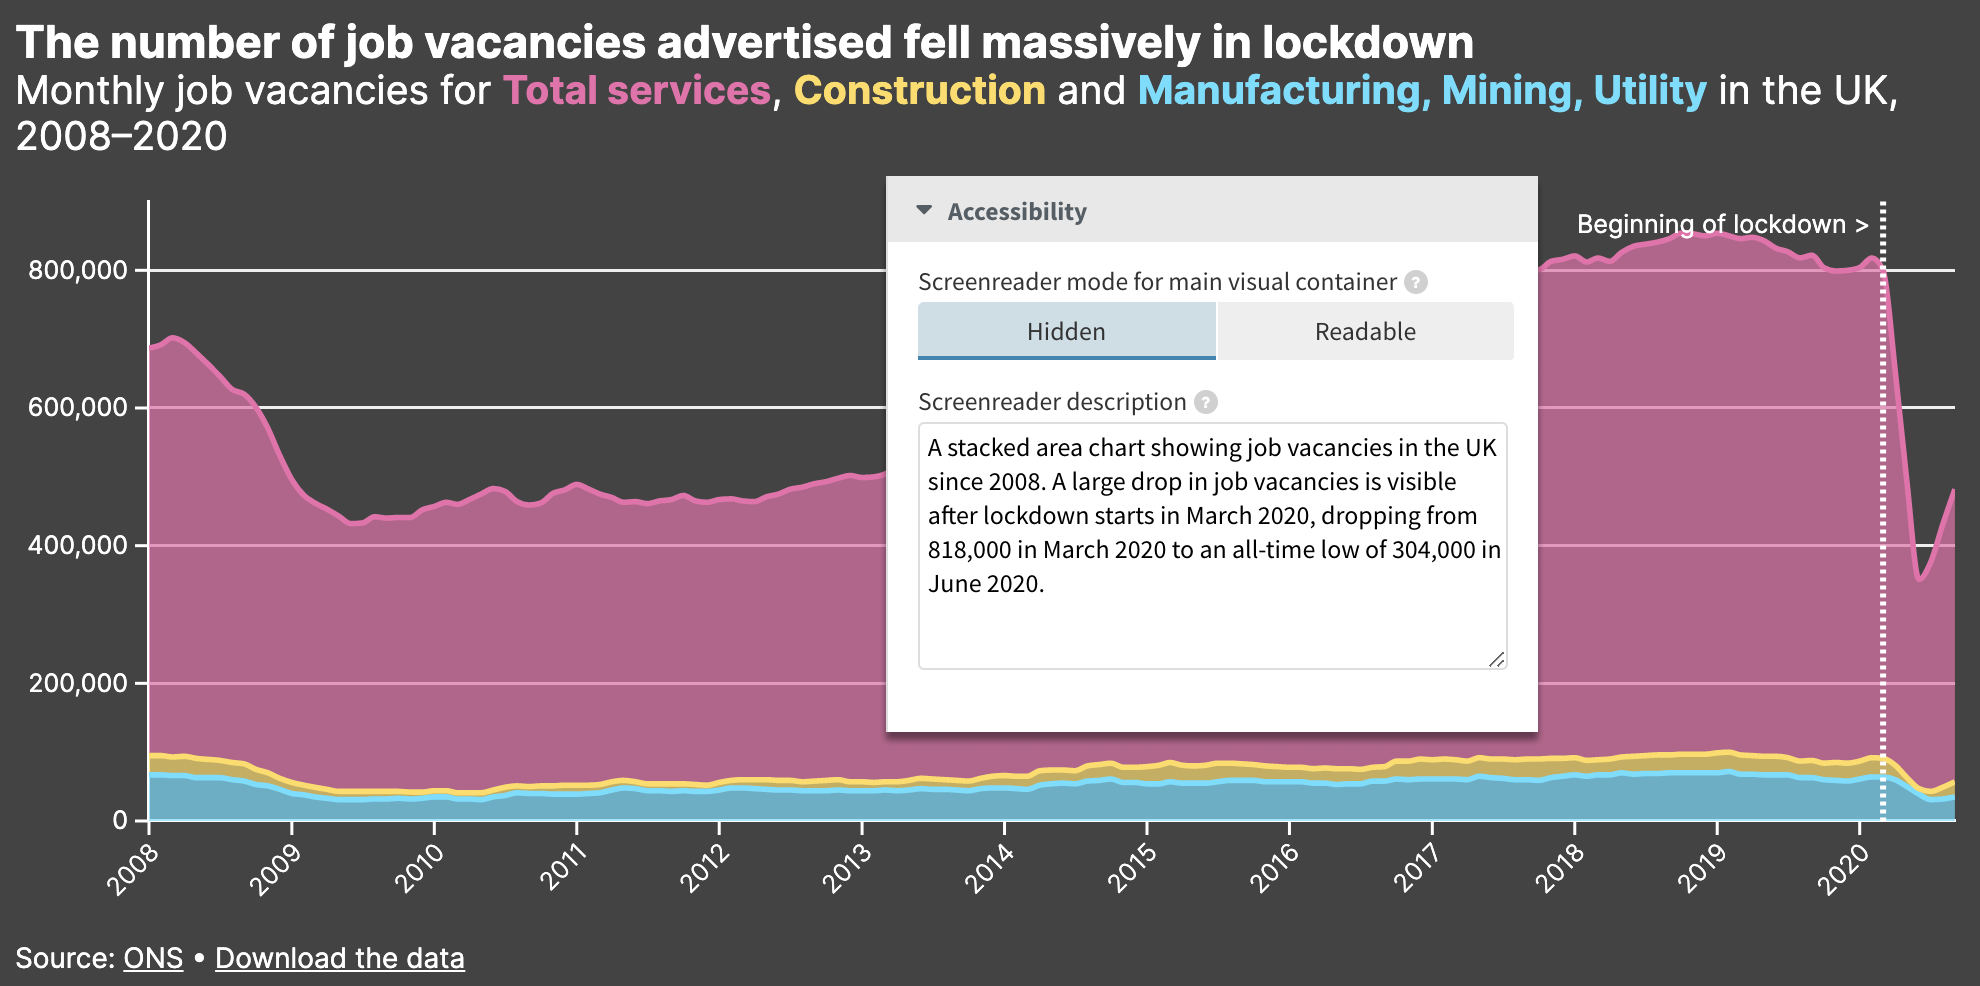
Screen reader descriptions
In the world of interactive data-driven content, accessibility is a relatively new field. We’re determined to innovate in this area, and we’re excited to announce a step on that journey: screen-reader settings to provide a text alternative to visual elements.
• Read about our new accessibility feature
Drag-and-drop annotations
Our new annotations system makes it easy to add labels, connector lines and arrows that display nicely across different devices. The system is now live in our Line, Bar, Pie and Scatter templates and we will be rolling it out further in the coming months.
• Annotations: read the blog post
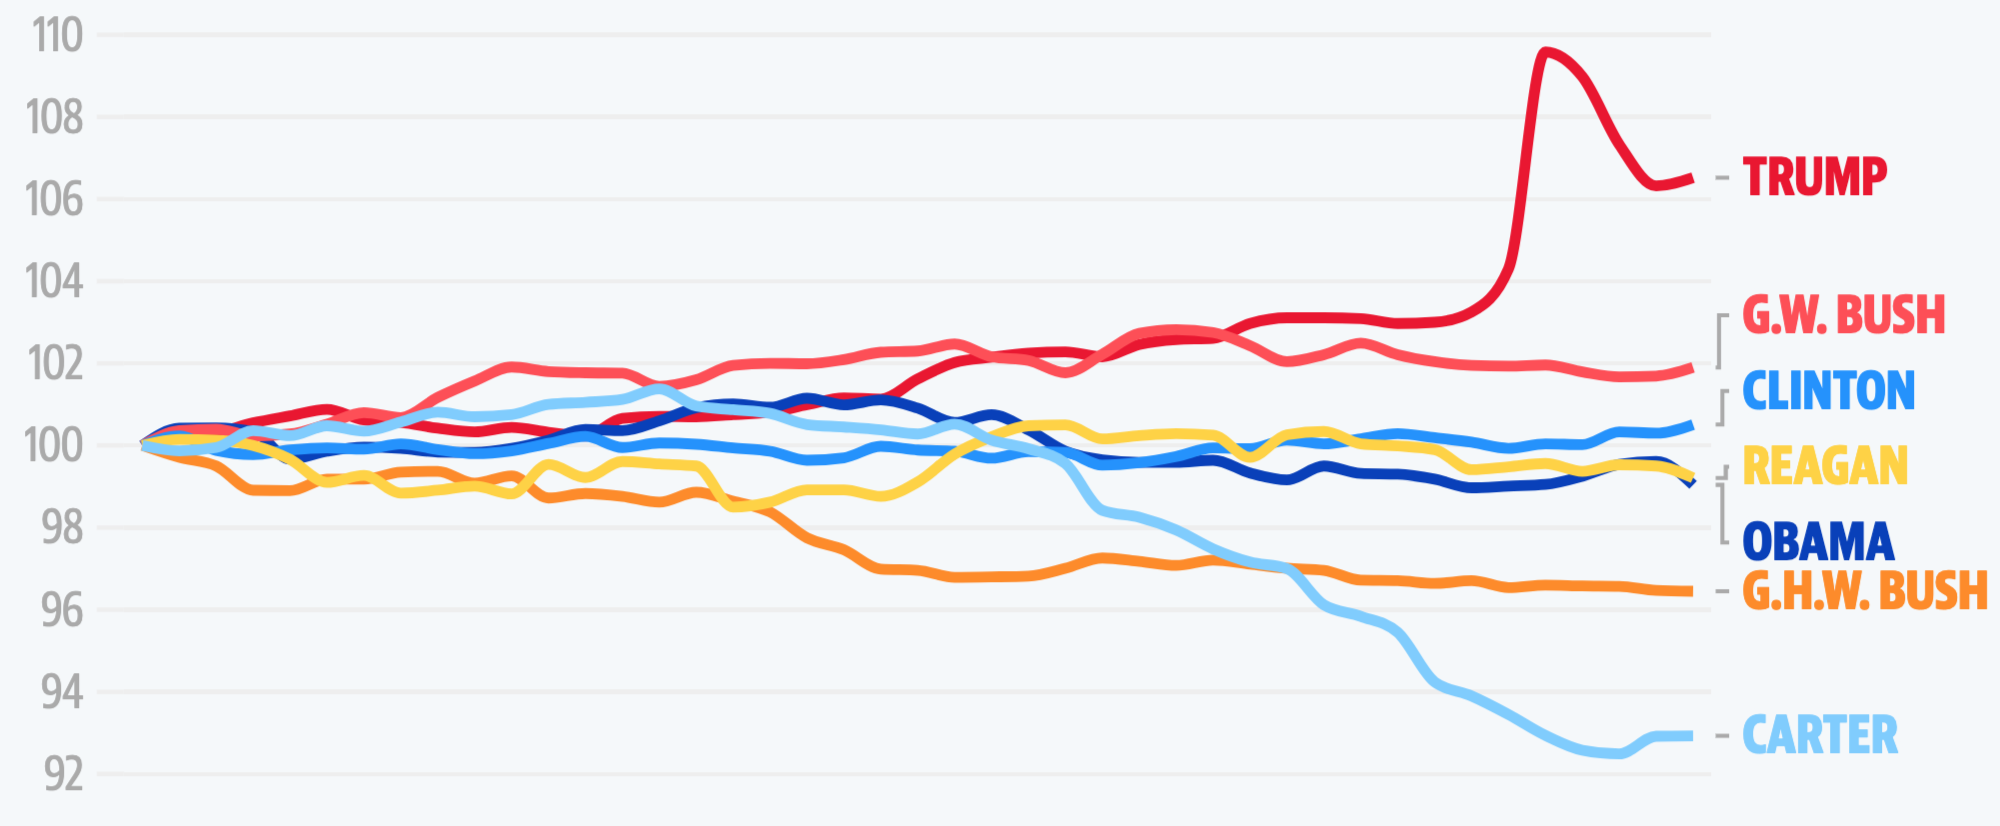
New line labels
We’ve greatly improved the labels in our line charts. The labels now automatically spread out to reduce overlap. They also offer straight or stepped connector lines. Here’s an example from Yahoo! Finance.
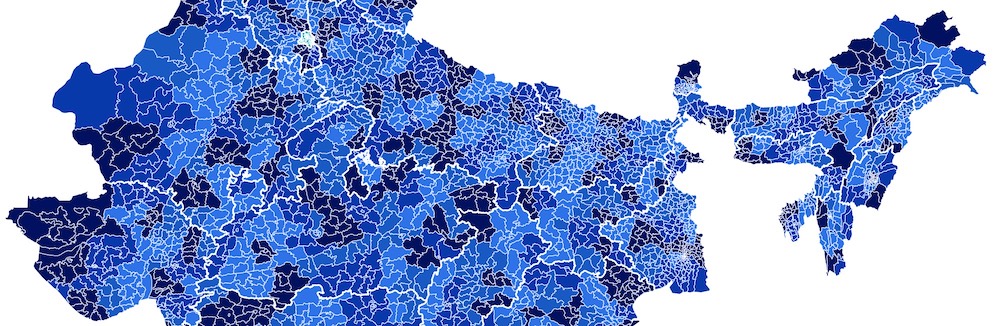
Region outlines in maps
Our Projection Map template now supports region groups, which you can use to create state outlines around counties, for example, or continent outlines around countries.
• See other map outline examples in our blog post
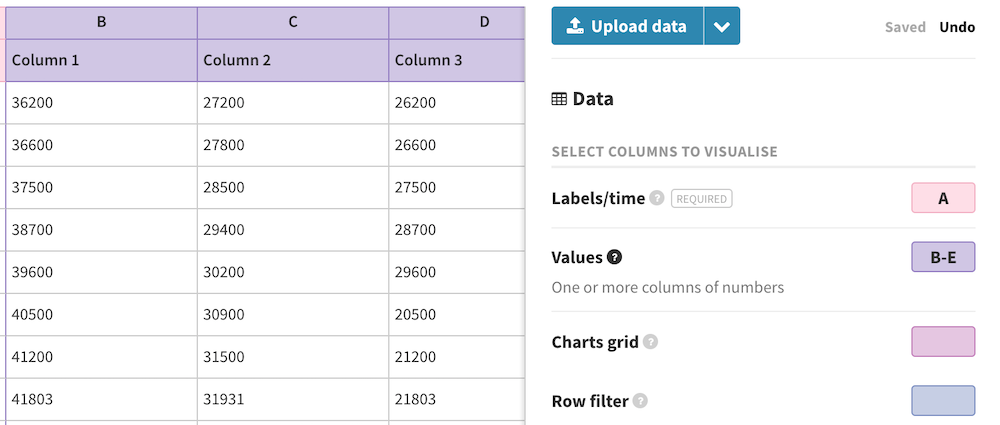
Cleaner data tab design
We have simplified the interface of the data area in the Flourish editor. Column settings now appear only for the selected data sheet, and a cleaner design makes it easier to navigate when there are a large number of settings.
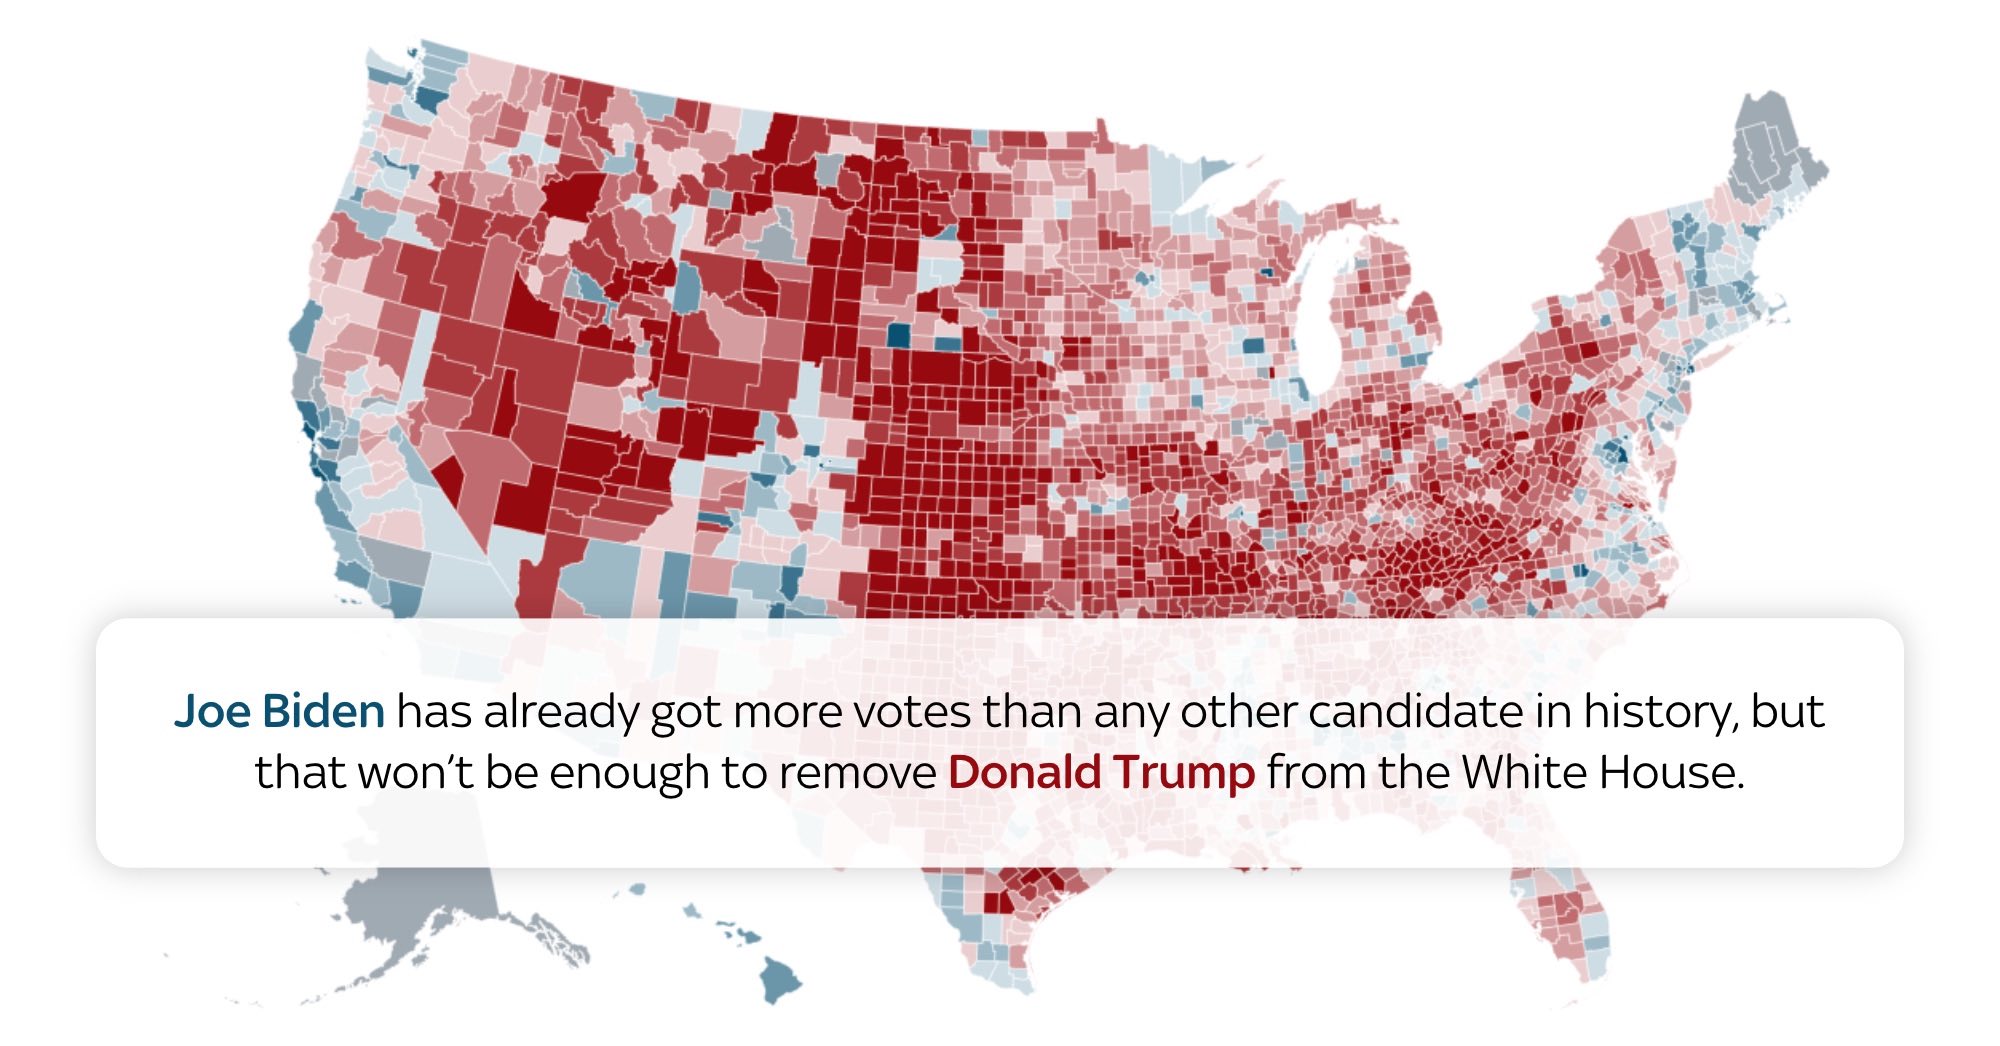
In the wild: elections and COVID
Thousands of Flourish users created amazing US election visualizations this month, from beautiful scrollytelling pieces to maps using our electoral college hexmaps example. US politics were also featured in a COVID bar chart race by Dan Goodspeed that went so viral people started writing articles about it.
Remove Flourish GA
Published Flourish projects include basic Google Analytics (without cookies). Enterprise customers can optionally now remove this. Contact us to find out more about the Enterprise plan.
Scheduled downtime: 12th December
In order to upgrade our database, we are planning around 30 minutes of scheduled downtime on 12th December at 02:00 UTC. You won’t be able to access the editor during this time, but live published projects (including those embedded on other sites) will not be affected.
We’re hiring!
We’re looking for a talented Software Engineer to join our team. Get in touch or spread the word!
We’ll be back in a few weeks with more updates. In the meantime, as always, just hit reply with any ideas, questions or feedback.
Best wishes,
Duncan and the Flourish team
Did someone forward this message to you? Join the list!
Flourish, part of the Canva family
33-35 Hoxton Square
London N1 6NN