Box plots: what are they and how to build one without coding
Use our box and whisker plot template to better explore the distribution of your data
Box plots, also known as box-and-whisker diagrams, are a common and useful statistical visualization. They let you see the distribution of your data quickly by highlighting the median and quartiles of each category. Optional “whiskers” extend out from the boxes and can be used to show which data points are outliers.
Box plots are available as a starting point in Flourish, so creating and publishing them online is now as easy as uploading a spreadsheet! Like every Flourish visualization, our box plots are mobile-friendly, animating and free to make and publish on a public account.
This example box plot shows the age of players in the 2022 Qatar World Cup from the countries that qualified for the playoffs.
Flourish charts animate between views, such as when applying a filter. Attacking players tend to be the youngest…
… while goalkeepers on average are significantly older.
You can use “whiskers” to highlight outliers...
And even break out the plot into multiple charts when useful.
Box plots can also be both vertical and horizontal...
And they work well alongside the scatter's beeswarm mode!
What can the Flourish box plots do?
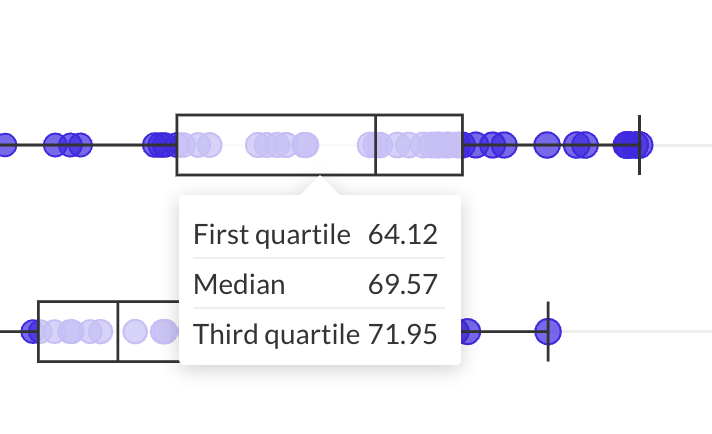
The Flourish box plot automatically calculates and displays the first and third quartile values, as well as the median.
As the example above shows, Flourish box plots have tons of useful features. One of the main benefits of this Flourish chart is that it automatically calculates and displays median and range values – all you need to do is add in your data!
In addition, it works well as both a horizontal and a vertical box plot, which makes it suitable for viewing on smaller screen sizes. To check which one works better for your visualization, simply swap the columns bound under the X and Y values in the Data tab – read our help doc for more.
When it comes to the box plot’s whiskers, our Flourish template allows you to set a maximum distance of how much they should extend out of the box – meaning that you can also remove them completely. As a rule of thumb, each whisker should not extend further than 1.5 times the IQR (interquartile range, in other words, the difference between the third minus the first quartile). Everything beyond this value will be considered an outlier.
Last but not least, you can add an interactive filter to help your users compare different categories. Using filters can truly enhance your data storytelling – see other examples of using animation to bring your data to the next level.
How to make a box plot in Flourish
- Make a new visualization using the Scatter template.
- Upload a CSV or Excel file, with one row for each dot in your box plot. To create a box plot, you need to plot one categorical and one numerical axis.
- How you bind your columns in the Data tab will determine whether your box plot will be vertical or horizontal. To make a horizontal box plot, choose a categorial variable for the Y axis and a continuous variable for the X axis.
- Turn on the box plot view in the settings panel in the visualization editor.
- Optionally, add a Filter data binding to allow the user to filter as in our example above, or a Time column to create a time slider.
- Tweak the colors, layout and popup settings until you’re happy.
- Publish it and share!
Hungry for some more scatter content?
Our versatile Scatter template is undoubtedly one of the most robust and dynamic chart types that Flourish offers. Whether you’re looking to create visually stunning violin and beeswarm plots or more intricate and complex visualizations, this template has got you covered! See some of our blog posts below to learn more.