All I want for Christmas… is data 🎵
Using Billboard charts and Google Trends data, we visualized the search trends behind the most streamed Christmas song, “All I Want For Christmas Is You”
Earlier this year Mariah Carey tried to trademark herself as the “Queen of Christmas” – but is she really worthy of this royal title? I took a look at search trends around her most popular festive tune to find out…
Look, it’s not that I hate the song. It’s not even that I hate Mariah Carey, because how could I? It’s just that there comes a point every year when all I want for Christmas is a time machine, so I can travel back to 1994 and make Mariah do anything – anything! – other than release “All I Want For Christmas Is You”.
This year, that point came when I was in a pub and it began twinkling over the speakers. I pulled out my phone to check I hadn’t become spontaneously concussed and forgotten an entire month of my life, but it was indeed the 9th of November.
As I sat there, I began to wonder if this phenomenon was uniquely British. Do other countries also love Mariah/Christmas so much they start listening to this song in mid-autumn?
So, in true data journalist fashion, I took a look at data from all over the internet, including Billboard and Google trends, and used Flourish to investigate. By checking when Mariah enters the Top 20 in each country, I got an insight into how each country celebrates the holiday season.
I don’t want a (dot plot) for Christmas
I began by looking at when AIFWCIY enters the global charts in each country over the last three holiday seasons. Turns out – yes! – there’s a small cohort of countries, including Denmark, the US, and the UK, which turn the song on abnormally early and turn it off abnormally late.
Special mention should also go to Denmark who have managed to keep Mariah in the top 20 most consistently over the past three years.
This chart uses a “Riley legend” - named after the original author of this blog! This is where you use the colors of the chart in the chart’s header in lieu of a traditional legend. In the Scatter template, this also works as a filter.
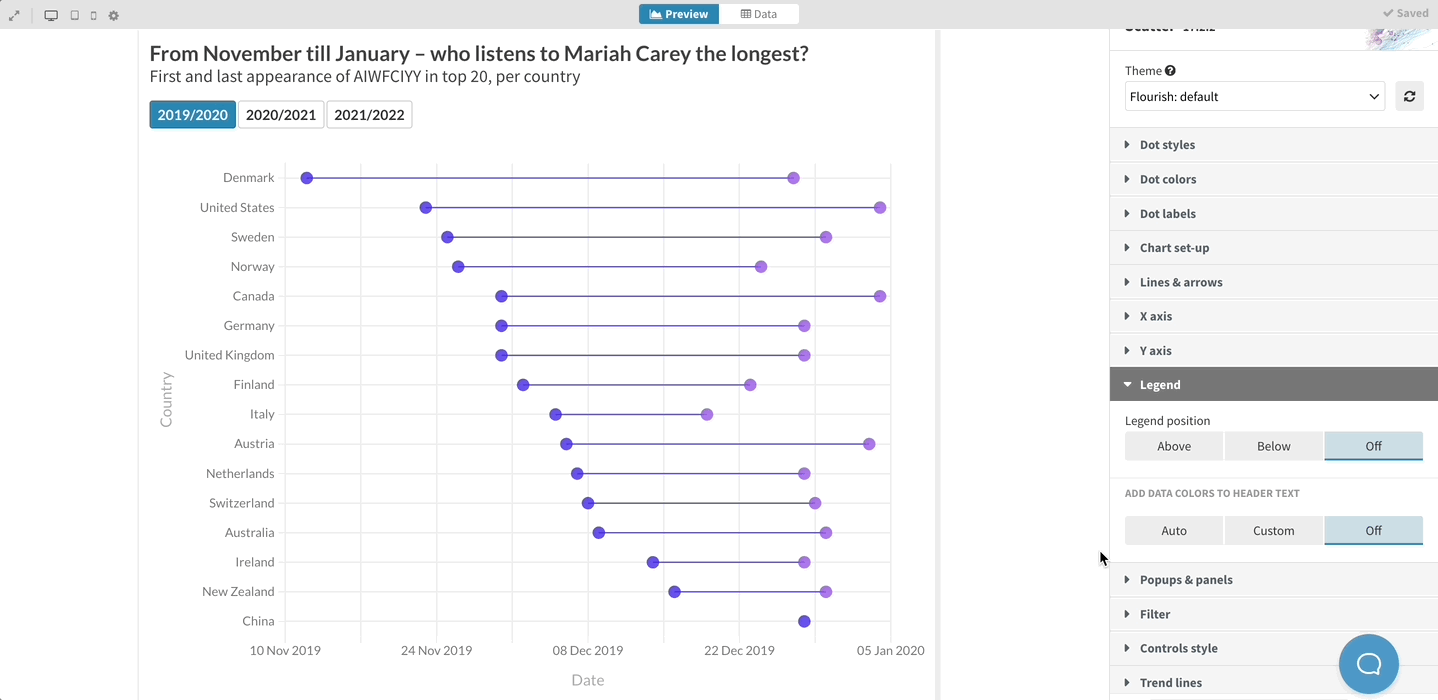
Find out more about Riley legends here.
There is just one (marker map) I need
For true festive insight, the chart below shows the top ten countries around the world who love Mariah the most, determined by their search interest in AIWFCIY since 2008.
Shoutout to the Philippines for being Ms. Carey’s number 1 fans!
Learn more about marker maps here.
Make my wish come true (with an interactive timeline)
But was Mariah Carey an instant Christmas hit? Or did it take her a few years to climb her way to the top of the tree?
To investigate this question, I took a look at historical data for the Billboard Hot 100 to see when AIWFCIY made its way into the charts.
Surprisingly, it took AIWFCIY until 2019 to top the Hot 100 for the first time in the United States with 45.6 million streams and 27,000 digital copies sold. This means that AIWFCIY was the slowest climb to the top spot in the chart’s history, with 35 consecutive weeks on the chart and 25 years after the song’s original release.
Happy holidays! 🎵