How we’re making Flourish visualizations more accessible
Explore our latest updates and learn about our commitment to accessibility
The data visualization industry is rapidly embracing the principles of accessibility and making notable strides: Last year, the New York Times appointed its first Accessibility Visuals Editor. The body of research on the topic is growing, new tools like Data Navigator are finding new ways to navigate content, and globally, organizations are adopting best practices to become more accessible. We’re all learning and creating better standards together, which is a promising development.
But taking a closer look, we can see that some existing solutions are insufficient and that it’s difficult to apply existing guidelines across various technologies and use cases. Conventional accessibility guidelines like WCAG are based on basic HTML pages with a clearly defined set of components, which are very different from rich, interactive visualizations with custom elements. Moreover, accessibility requirements can sometimes pull in different directions, depending on the type of impairment you’re building a solution for.
For example, while providing raw data tables as a fallback option to visual charts is often recommended, this approach may work well for certain types of disabilities but not others – and it doesn’t in any way offer readers to spot patterns, trends and outliers – which is arguably what data visualization is all about.
Charts speak to our visual nature by breaking down numbers into easily processed patterns, making them an accessibility tool in and of themselves
Data visualizations are great for a number of reasons: They speak to our visual nature by breaking down insights into visual patterns our brains can process (making them a kind of accessibility tool themselves). They make complex data more digestible by encapsulating vast amounts of information. And they’ve become an absolute necessity for conveying critical information, illustrated for example by the pandemic, where well-designed charts and maps became the status quo for communicating fundamental facts.
Because charts are everywhere, we need to ensure that everyone can consume the messages they are conveying. At Flourish, we aim to transcend basic compliance, focusing on enhancing user engagement and understanding.
More than just compliance: A holistic approach to accessibility
Accessibility isn’t just about ticking off boxes; it’s about inclusivity. Whether it’s color blindness, motor difficulties, or cognitive challenges, the goal is to make data visualizations accessible and meaningful to everyone.
Non-accessible visualizations not only limit user engagement but can also incur legal ramifications. Meeting Web Content Accessibility Guidelines (WCAG) AA standards is increasingly becoming a legal necessity, leading to potential financial and legal repercussions for non-compliance.
While Flourish hasn’t yet pursued AA accreditation, our platform offers tools that enable you to make your charts accessible. In close partnership with our customers, we’ve rolled out several enhancements over the past six months to meet these standards. Let’s take a closer look:
1. Keyboard navigation
Keyboard navigability is a cornerstone of web accessibility. For users that are not able to use a mouse because of functional or visual impairments, interactive data visualizations can be frustratingly out of reach for meaningful interaction or learning. Often they feature content that is not accessible without hovering or clicking.
Keyboard users can now navigate Flourish visualizations with ease, interacting with legends, dropdowns, buttons, and data points seamlessly.
One way to offer an accessible experience to these users is to ensure they can access any visualization content via the tab key on their keyboard instead of just a mouse.
Over the past few months, we’ve been hard at work enhancing the keyboard navigability of our visualization templates. As of now, 30 out of approximately 40 visualization templates are fully compatible with both mouse and keyboard interactions. This allows users to delve into data points, adjust filters, and engage with popup content, regardless of whether they have access to a mouse. We’re committed to extending this functionality to more templates in the near future. For real-time updates on accessibility features across our templates, visit our accessibility page.
🚀 What's new? We've enhanced the large majority of our visualization templates to support keyboard-navigable primary graphics. Before this, headers, legends and controls were already keyboard accessible, but now it’s all chart elements.
💜 Why you should care: This change ensures that people accessing websites with their keyboard – because they might not be able to use a mouse – can fully navigate around Flourish visualizations, whilst also having a screen-reader description.
2. Screenreader features and ARIA attributes
We’ve long offered built-in support for screen readers in our core visualization templates, making titles, subtitles, and footers automatically read out whilst also offering the option to supply a description of the main visual aspects in your visualization.
Our latest improvements extend screen-reader support to chart elements themselves by incorporating a comprehensive set of ARIA attributes. ARIA, or Accessible Rich Internet Applications, complements HTML by providing extra layers of description and context for screen readers. This enhancement means that more complex elements like buttons, data points, and popups become more intelligible to screenreaders.
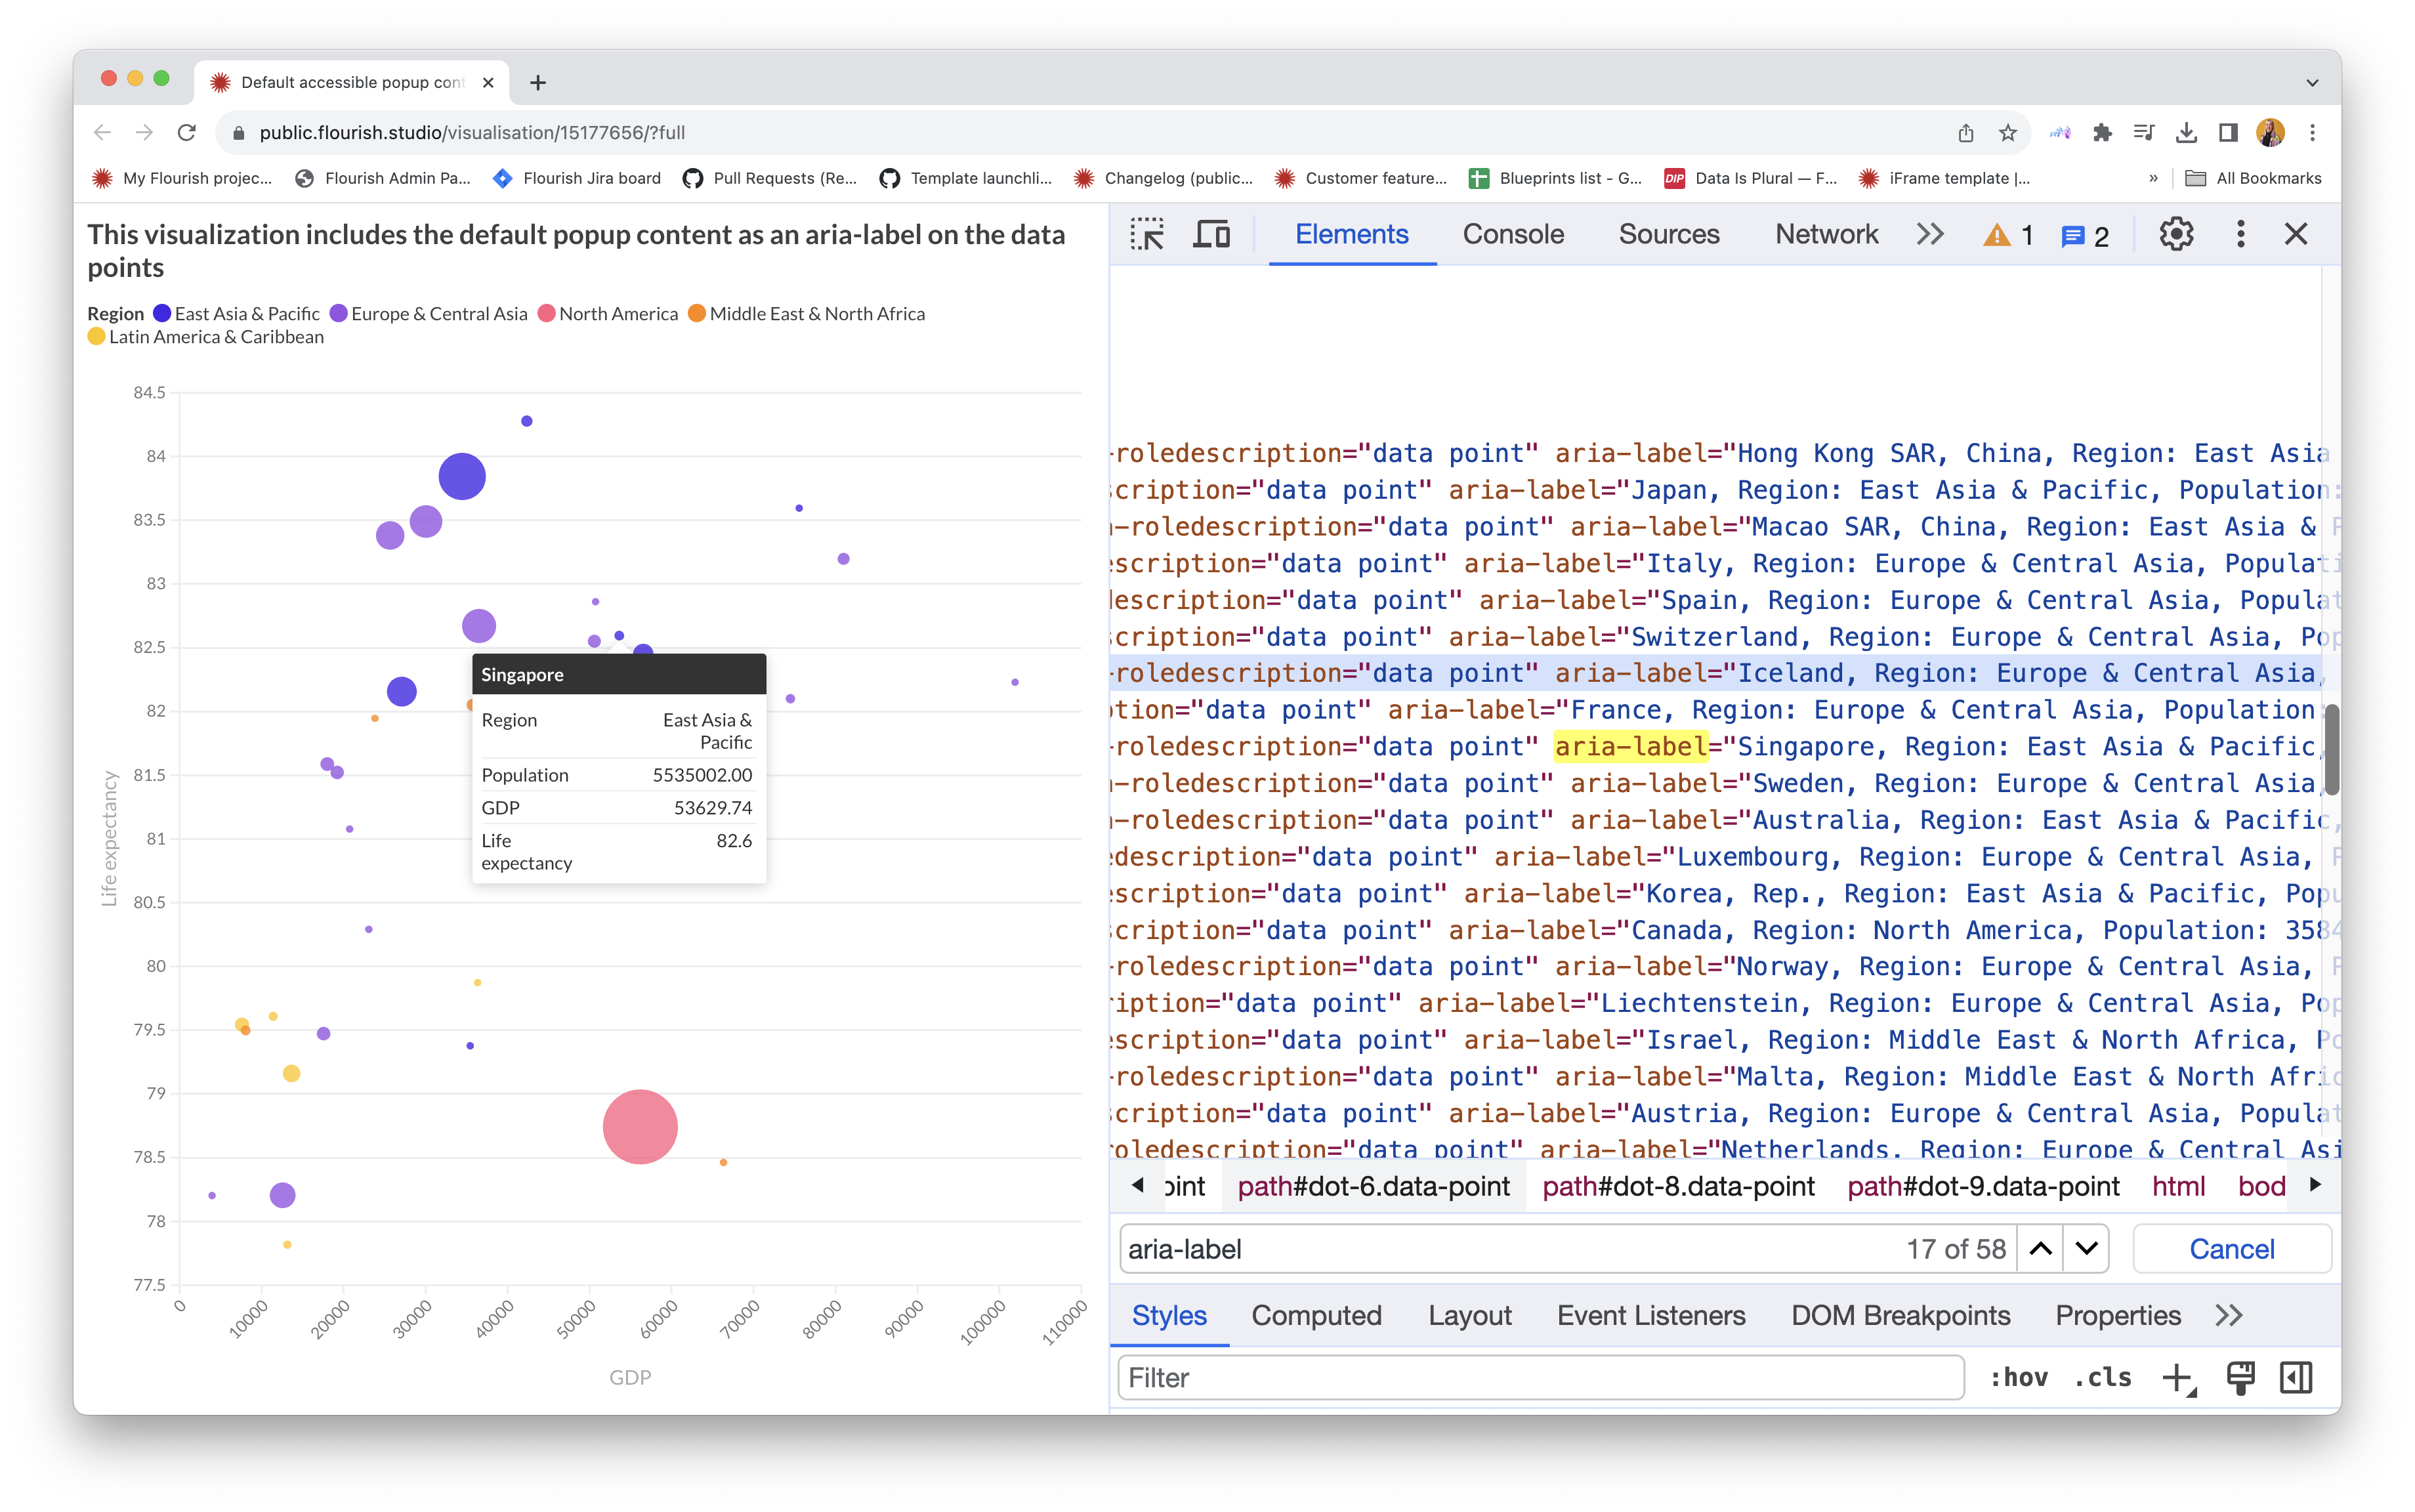
Screen readers can now interpret data points and popups in a much more meaningful way through ARIA attributes.
These are the ARIA attributes we use to make Flourish visualizations accessible to screenreaders:
- For the ARIA role of the data point, we use
role="img" - For the ARIA label of the data point, we use the same content as the popup, eg.:
aria-label="United Kingdom, Life Expectancy 81.6 years" - For the ARIA role description of the data point, we use
aria-roledescription="data point"
We’ve also rolled out a dual experience: a fully readable main graphic paired with detailed screen-reader descriptions. Our newly-integrated ARIA attributes ensure that screen readers interpret data points and popups in a meaningful way, whilst a screen-reader description is great to supplement the main visual aspect of your chart.
🚀 What's new? We've added additional ARIA attributes for a better screen reader experience, ultimately making data points and popups readable to screenreaders. We've also ensured you can set both a screen-reader description whilst having a readable visualization container, so screenreader users have access to the full picture.
💜 Why you should care: Our newly added ARIA attributes optimize screen reader compatibility, transforming complex chart elements like data points and popups into accessible, contextualized information. By doing so, we bridge the gap between your rich visual content and assistive technologies. This allows for a more inclusive user experience, enabling everyone to engage with your data visualizations in meaningful ways.
3. Improved auto contrast
High contrast colors, along with separation and space, are crucial for helping people with vision impairments read your charts. By default, colors in Flourish palettes meet accessibility requirements for graphical elements, and it’s possible to set up your company theme to include accessible colors as well.
In addition to this, some of our templates already support auto-contrast labels on chart elements. These automatically adjust the text color to achieve the best contrast with the surrounding graphical elements based on the new Advanced Perceptual Contrast Algorithm (APCA). Unlike The Web Content Accessibility Guidelines’ algorithm, which we used before, APCA provides a more accurate estimation of human contrast perception, which depends on which color is used for text and which for the background, and which text size and weight is used.
Left: A treemap without auto-contrasting labels on chart elements. Right: A treemap with auto-contrasting labels on chart elements. This feature was introduced in Hierarchy v18. Source: Our World in Data • Population abundance refers to the number of individuals that make up a particular species or group in a given habitat or ecosystem. Data as of 2018
We’re currently working on adding auto-contrasting features across even more chart elements and features, so stay tuned for feature developments in the coming months.
🚀 What's new? We've added auto-contrasting chart elements to several templates and switched to the better APCA algorithm for detecting contrast. APCA will also be the contrast check included in WCAG 3.0.
💜 Why you should care:It's hard to read light text on a light background and vice-versa. Auto-contrasting labels on chart elements solve this issue. Additionally, APCA provides more accurate, legible contrast checks compared to WCAG standards.
4. Introducing reduced motion features
Animations can enhance the visual experience of your data visualizations, but for users with vestibular disorders or sensitivities to motion, they can be disorienting or distracting. Relevant Flourish templates now respect system-level “Reduce motion” settings via the prefers-reduced-motion CSS media feature, ensuring a comfortable user experience.
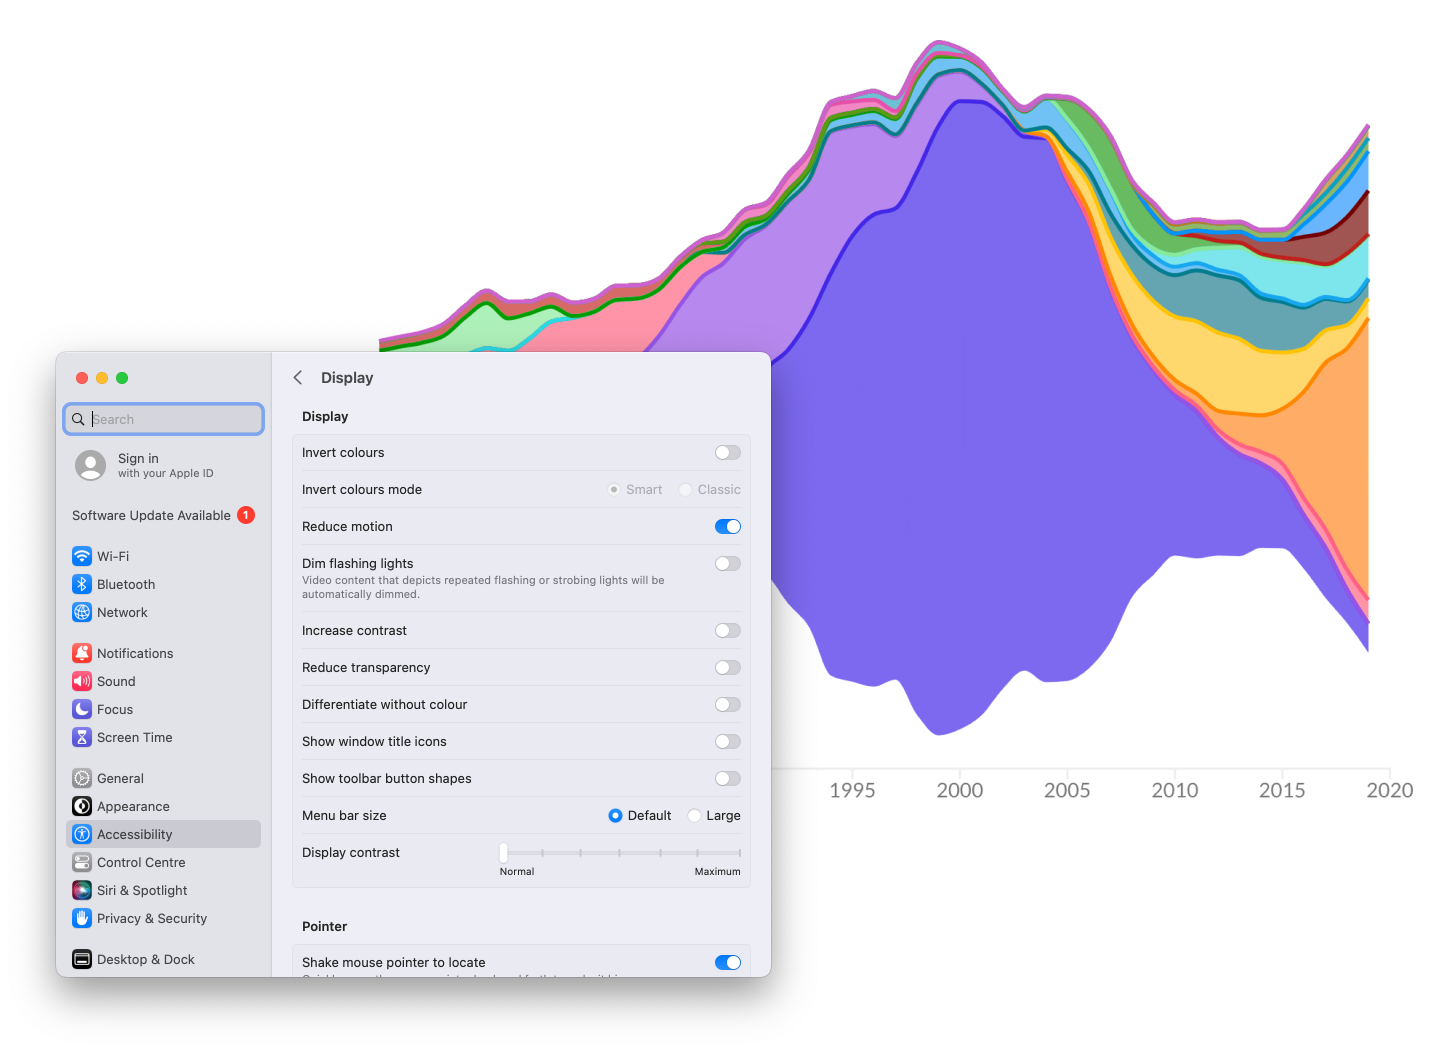
When users have enabled a preference for reduced motion in their system settings, relevant visualization templates will now disable all animation in the visual.
🚀 What's new? Relevant Flourish templates now take system-level
prefers-reduced-motion settings into account and disable animations when this setting is enabled. You can find a list of which templates support the new features here.💜 Why you should care: Excessive motion can be distracting, harmful, or resource-intensive, making it crucial to consider user preferences.
The power of creating accessible visualization also lies with you
When creating data visualizations, it’s not just about choosing the right chart or graph; it’s about knowing your audience and the message you want to share. Each element of your visualization — from the type of chart, to the data you include, to the language you use — should be carefully selected. Being open to change and creative in how you present information can make your visualizations more effective and memorable.
Accessibility should be a key part of this process, just like picking the right chart or a fitting title. Your choices in text labels, color schemes, and screen-reader descriptions are vital for meeting accessibility guidelines. For more tips on what you can do to design more accessible data visualizations, check out this blog post.
Next up on our accessibility roadmap
Next up, we aim to focus on improved auto-contrasting across even more templates and chart elements, as well as dark mode, ensuring the user can view a table of the raw data, or download a CSV, a “skip chart” button hidden somewhere, as now a keyboard-only user would take forever to Tab through the chart to get to any links or buttons below the chart.
That’s it for this detailed overview of what we’re doing to make visualizations created with Flourish more accessible. We’re aware there are still loads of improvements to make and many things to learn, so we’d love to hear your suggestions, feedback and ideas on the topic. Feel free to get in touch via Twitter or email! Stay on top of developments in this space on our accessibility page.