Let’s get merging! You can now join datasets more flexibly than ever
Introducing our improved data joining and downloading functionality
Cleaning and wrangling your data is often the first step to creating a compelling visualization. Even if you know the format your data needs to be in, it can be tricky to get there. Merging two datasets is a good example. Hence we’re excited to announce our improved data merging and download functionality.
“Merging” two datasets into one based on a column of shared values has always been possible in Flourish, but we’ve now made the process a lot more intuitive and powerful.
Detecting shared columns
To merge two data sheets, you’ll need a common column to “join” on. In the example below, we started with our Australia map blueprint, which comes preloaded with a datasheet containing geographic data and codes about the Australian regions. We’re then merging in some population data from the Australian Bureau of Statistics. Both datasets include the three-letter state abbreviation, allowing us to merge based on this common column.
Simply drag in your dataset and Flourish will detect the most suitable columns to merge on
To get started, select Upload and merge from the upload dropdown or simply drag your CSV or Excel file into the data tab and choose Merge with current sheet. While this part was already possible, Flourish will now analyze the two datasets and detect the column that is most similar, so in most cases you won’t have to select this manually.
A preview area will show you what your data will look like after the merge, coloring the new column headers blue.
New merge options
In addition to detecting shared columns, it’s now possible to customize the details of the merge process. This is useful when one dataset has more data than the other so not every row has a match. You can configure what to keep and what to “throw away” via the checkboxes in the merge dialog.
Merge in the new column or keep both? Our new merging options have got you covered.
In the past, the merge dialog defaulted to only importing data that had a match in the existing dataset. In data science, this is referred to as a left join. It’s now possible to choose from other types of joins, too.
Here’s a quick summary of the different types of joins:
Downloading unmatched columns and more
A downside of our old data merging functionality was that it you couldn’t tell which rows had been excluded from the final dataset because they had failed to match. Now there are two options: use the settings described above to retain those rows, or use the new download unmatched columns link in the right corner of the merge dialog. This will give you a CSV file containing the unmatched rows. This can be useful for highlighting data points that might not have matched because of minor spelling differences, for example. You can then fix these up in you source data and try again.
In addition, you can now select to download the dataset in any visualization as Excel, JSON or GeoJSON in addition to CSV format.
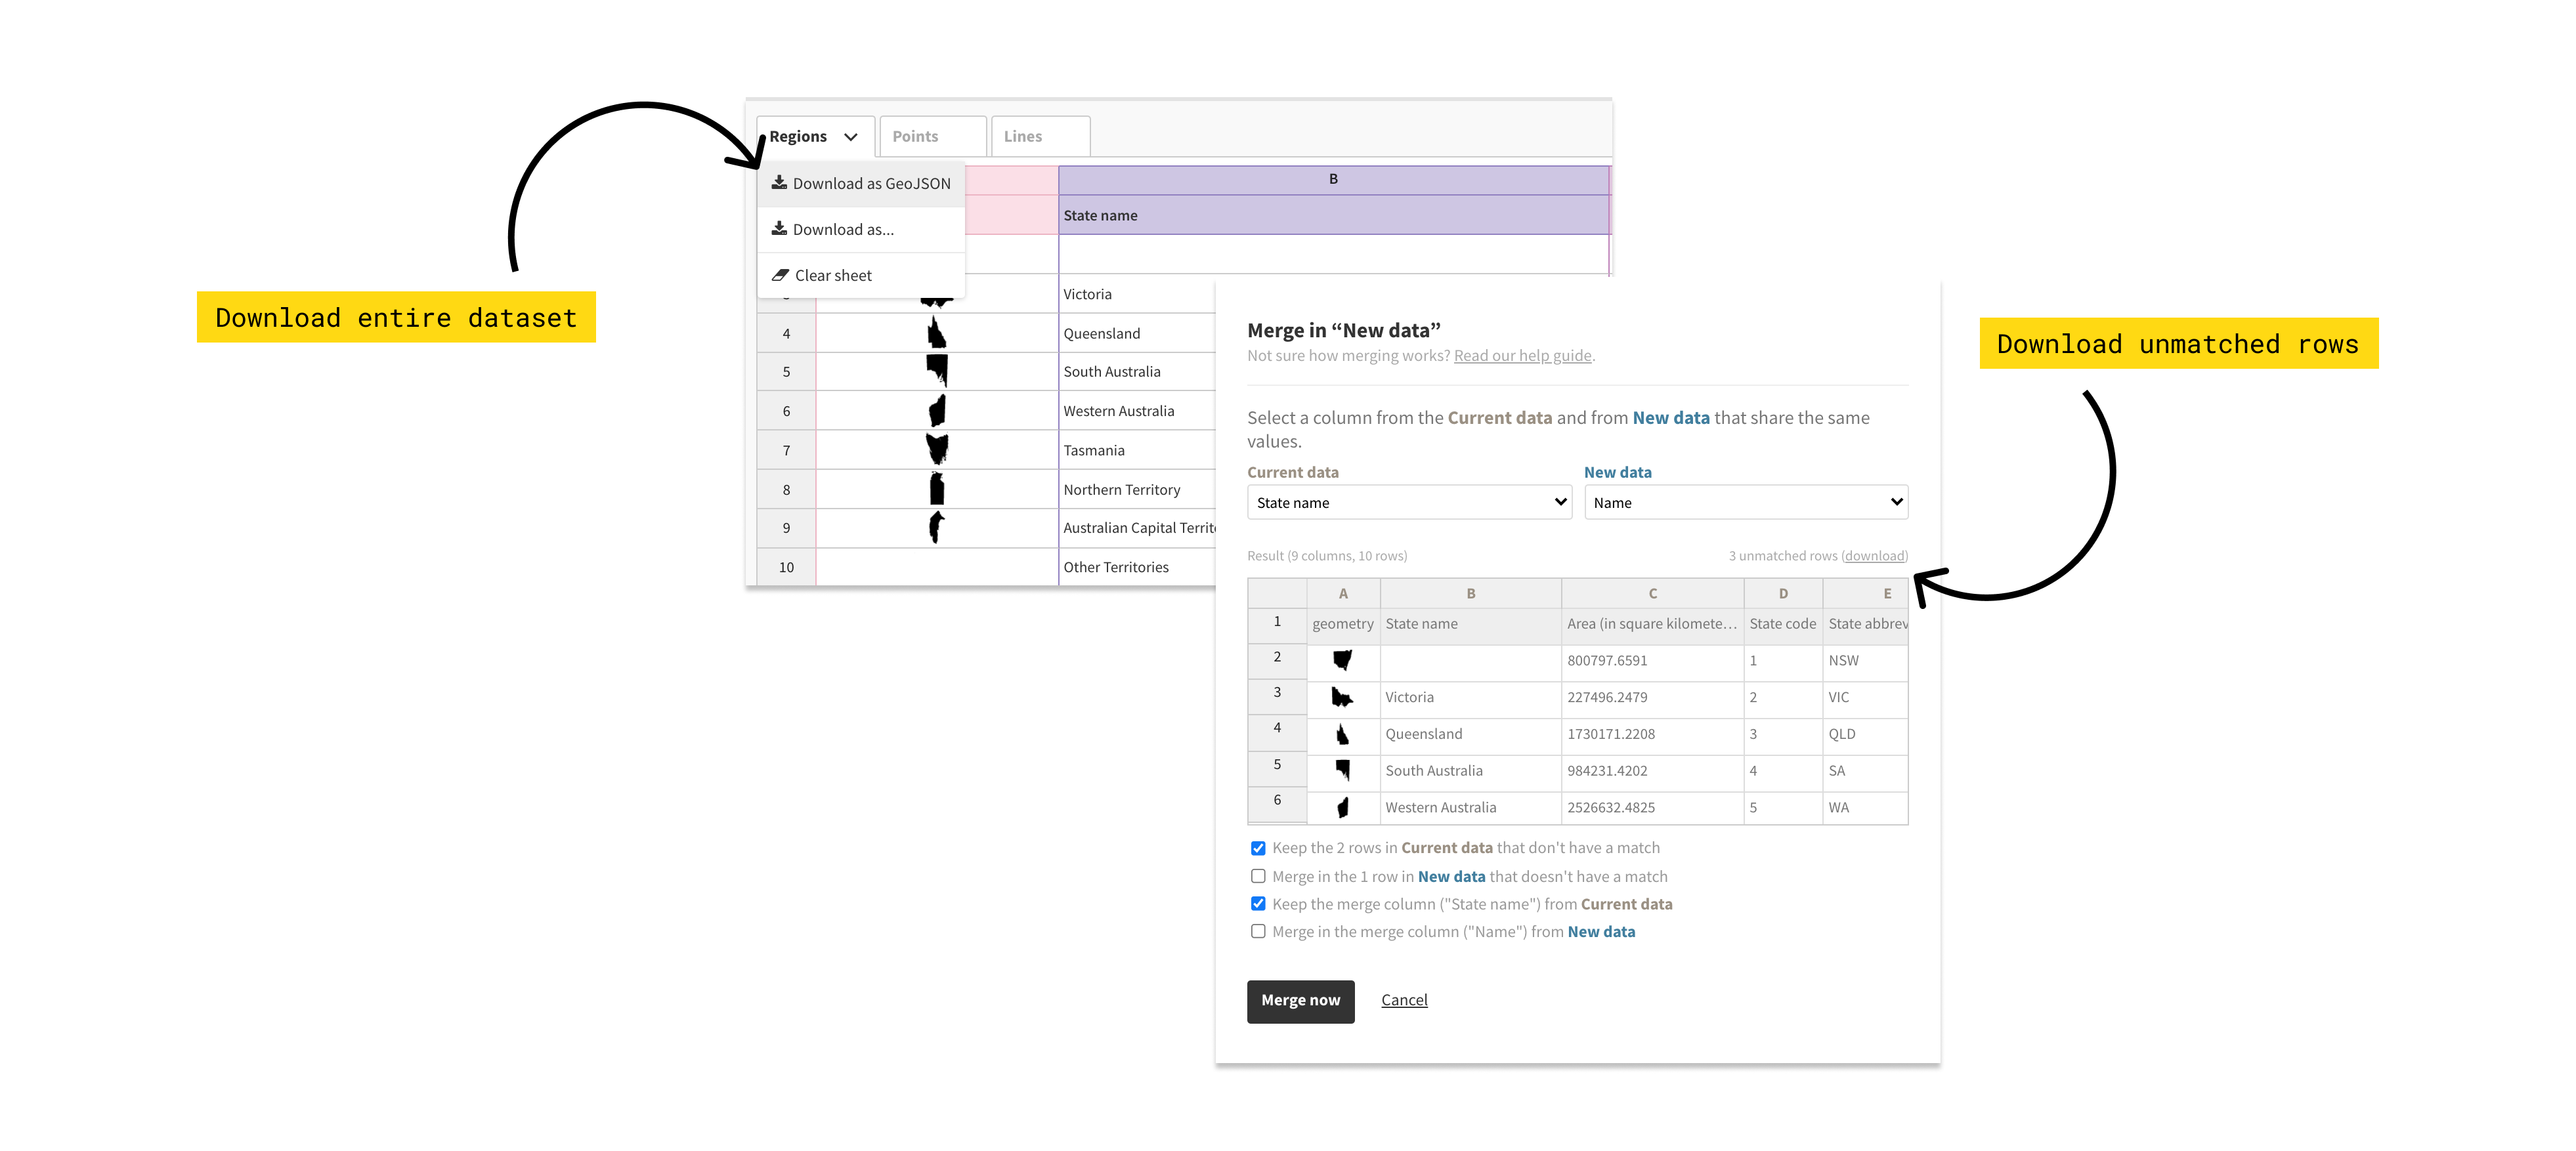
You can now download unmatched columns as well as your entire dataset in three different formats.
Ready to merge?
Our new data merging and download functionality should give you even more power for wrangling your data directly in Flourish. We’d love to hear what you think, and what you’d like to see added or changed. Tag us on Twitter or drop us a line at hello@flourish.studio.