Unveiling patterns: how to master interactive heatmaps with Flourish 🔥
Explore heatmap examples, from climate science to market trends
Whether it’s spotting trends in global weather patterns or understanding user behavior on a website, heatmaps serve as an intriguing visualization type to present rich data sets.
With their ability to highlight variations and patterns with just a glance, heatmaps don’t just represent data – they bring it to life, allowing us to see through the numbers and grasp the underlying stories they have to tell.
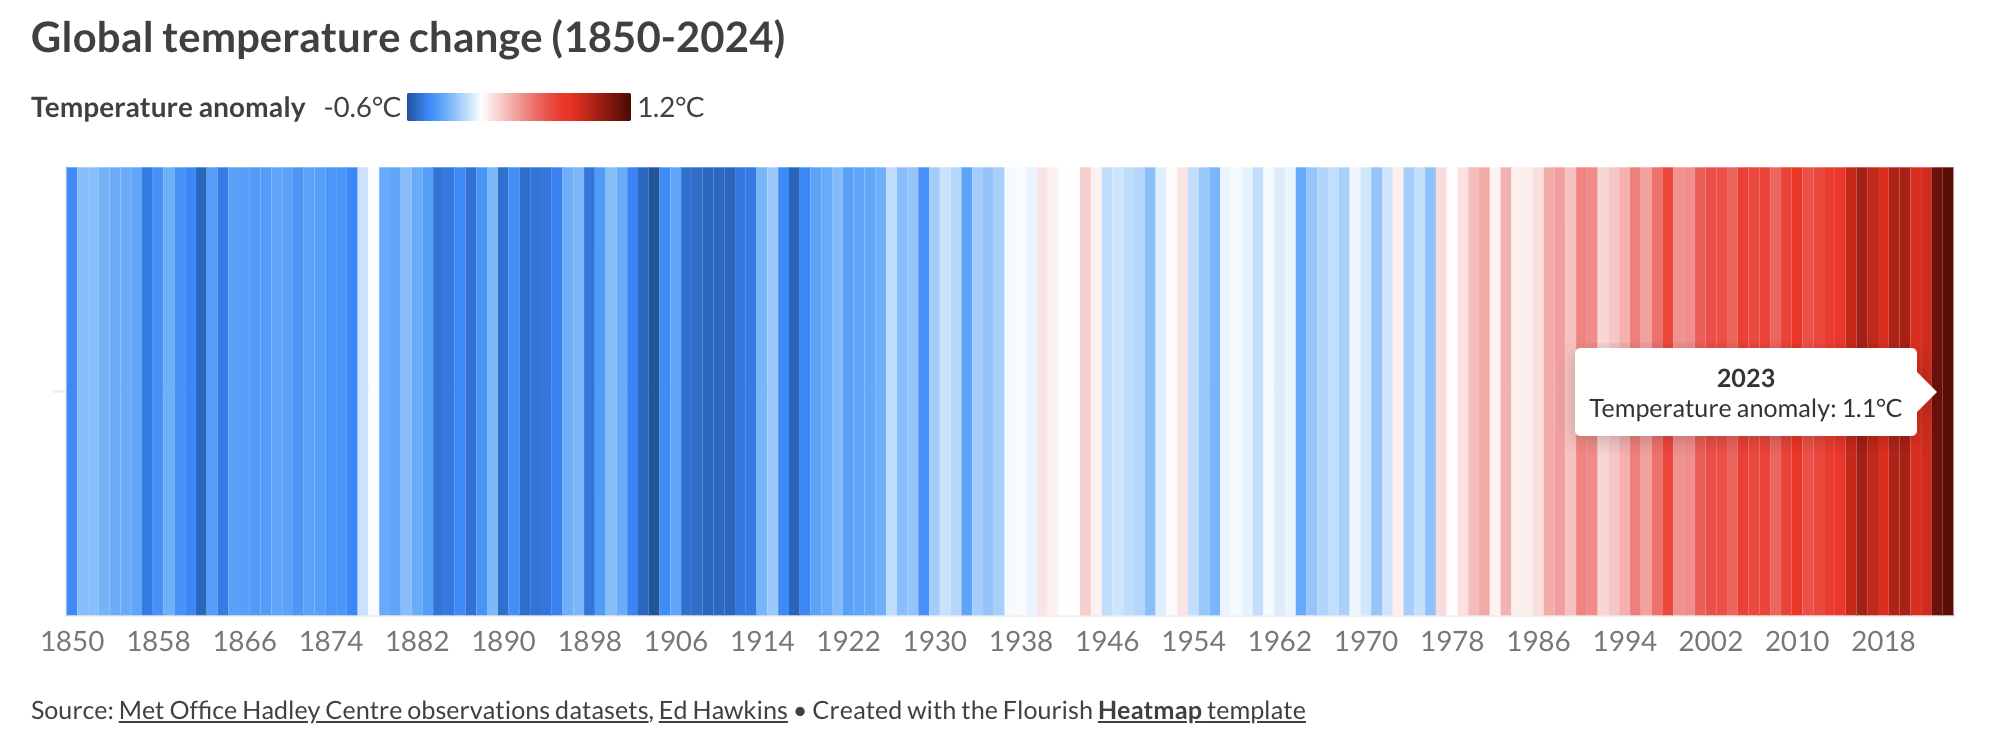
When we first launched the Heatmap template in 2020, it was inspired by the climate stripes visualization, a heatmap by climatologist Ed Hawkins showing global temperature rise since the nineteenth century.
But the first heatmaps were created much earlier, in the 1800s.
The first known usage of heatmaps is by Toussaint Loua, a French statistician. In 1873, he created a heatmap to track various social statistics in Paris. He already followed the same color conventions we know today – dark grey and black for higher values and light colors like white and light grey for lower values.
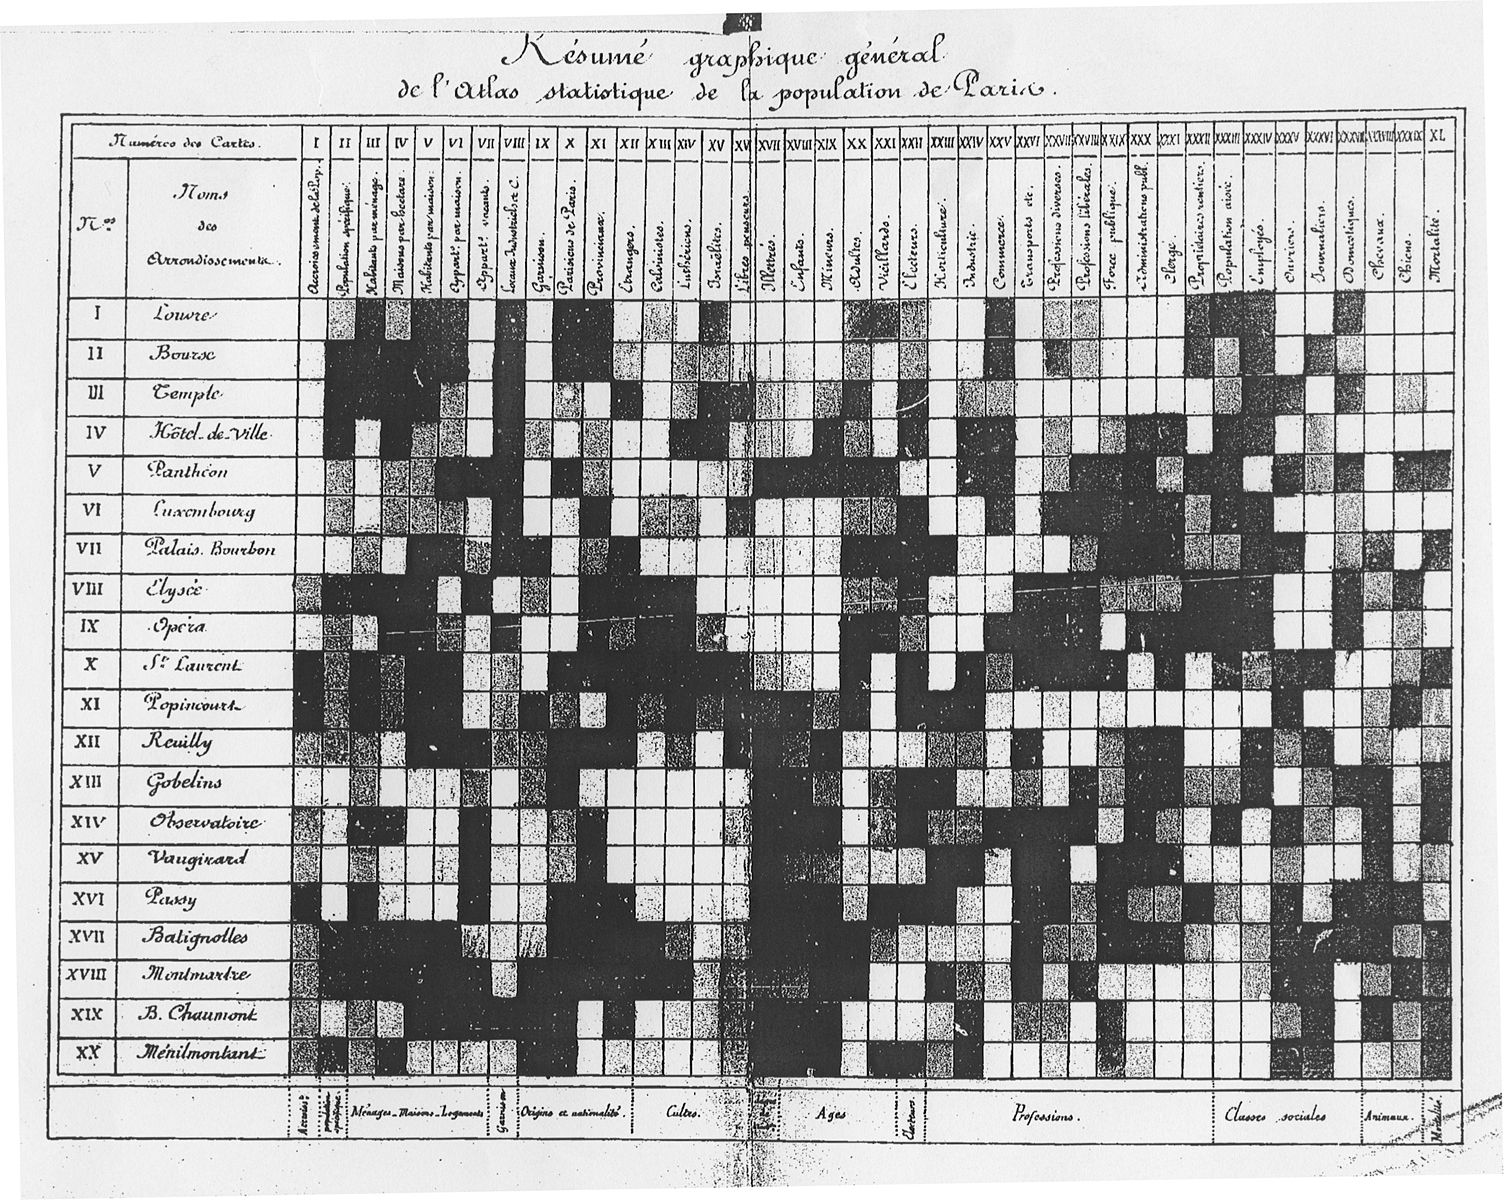
Source: Wikimedia
Today, heatmaps have become a go-to data visualization not only for statisticians but marketers, business owners, biologists, climatologists, and many more. Keep reading to see examples of heatmaps from different industries!
What are heatmaps?
Heatmaps are great for revealing patterns across two or three numeric or categorical variables.
At the core of a heatmap is a grid structure. The grid is composed of cells arranged in rows and columns. Each cell represents a data point at the intersection of a specific row and column.
The color of each cell varies according to its value, following a color scale that usually transitions from cool to warm hues to signify a range from low to high. To interpret the chart, a legend explains the color coding.
The above climate stripes example is a 1D, one-directional, heatmap, presenting information along one axis.
Our Heatmap template also supports more traditional 2D, two-directional, heatmaps, such as the following example which reveals a clear negative trend across all cities in 2007.
Numerical vs categorical heatmaps
Both examples above have categorical columns (or dates being treated as categories) for the axes, and a numerical column for shading.
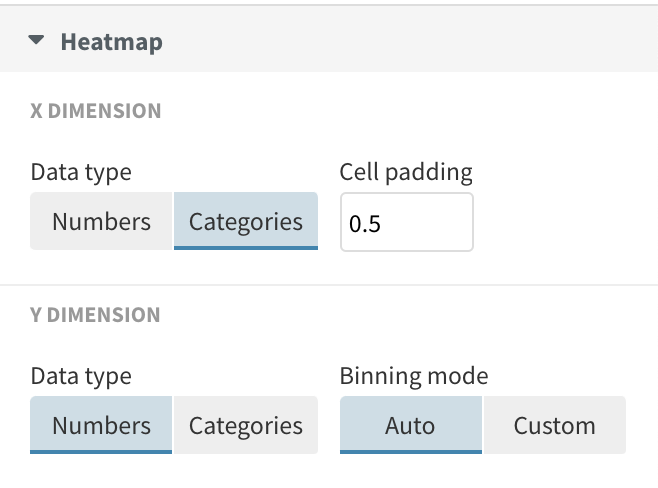
This isn’t fixed, however. You can also plot numeric columns on one or both axes, as shown below. To do this set “Numbers” under “Data type”, and the template will divide the data into “bins”, each representing an equal range along the axis.
Conversely, it’s possible to use a categorical column for coloring, as shown by the following example.
Popular use cases for heatmaps
Heatmaps are versatile in the field of data visualization and have several use cases across different industries:
- Statistical analysis: In the form of correlation matrices that show the relationship between multiple variables, with colors representing the strength and direction of the correlation.
- Market research: To show consumer behavior patterns, preferences, and demographic distributions, which can inform targeted marketing strategies.
- Survey data: To track replies to survey questions, patterns and trends over time and across different categories.
- Finance and trading: To monitor stock market activity, with colors indicating the performance of stocks, sectors, or markets, often in real-time.
- Climate science: To illustrate variations in meteorological data, such as temperature or precipitation patterns across different times and locations.
- Educational assessments: For visualizing test scores and performance metrics of students across various subjects or skills.
- Healthcare: For example to track the spread of infectious diseases or to track various clinical performance metrics across different departments in a hospital.
- Performance metrics: In business intelligence dashboards, heatmaps display sales, revenue, or other performance indicators across different regions or product categories
How to create and customize heatmaps in Flourish
Flourish makes it simple to create custom heatmaps by just pointing to two or more columns in a spreadsheet. Plus, there are several ways you can enhance your heatmaps:
- Use interactive features, such as a filter to let the viewer explore different categories or subsets of the data. You can even add a flip or fade animation when the data changes.
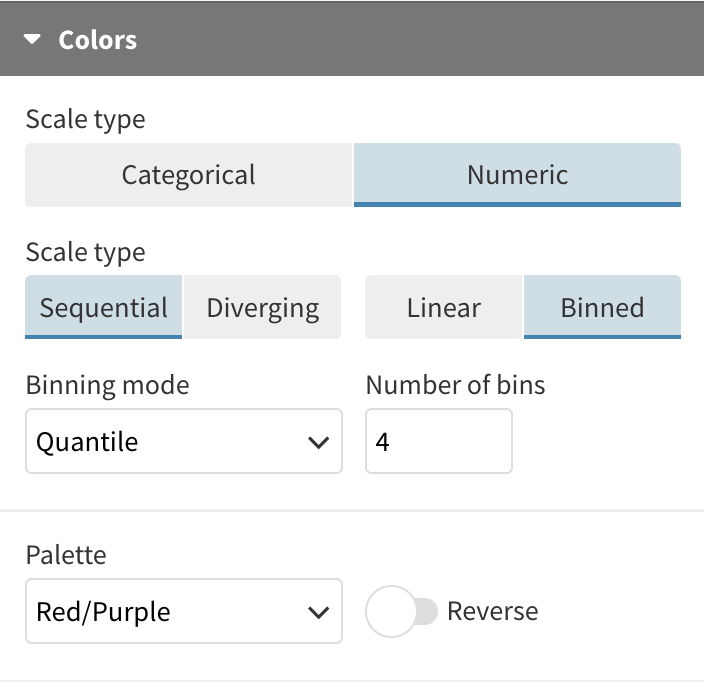
- As in other Flourish templates, rich settings are available to control numeric color scales. Try a quantile scale to create color bins that each contain an equal number of cells on the heatmap.
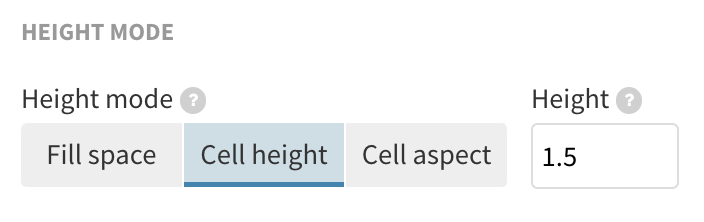
- Find the best sizing mode for your chart. You can let the cells resize to fill the available space or you can fix their aspect ratio (e.g. to make little squares) or their height.
- Make use of popups to counteract one of the drawbacks of heatmaps: because of their reliance on colour to communicate values, it’s harder to accurately tell the differences between colour shades and to extract specific data points. Add popups to your heatmap and anyone can see the exact values when hovering over a cell.
That wraps up our journey through the world of heatmaps. Now it’s your turn – create interactive heatmaps that highlight patterns and trends in your data.