It’s about time: bring history to life with interactive timelines 🕰️
Design beautiful, responsive and interactive timelines that represent key events over time and captivate your audience
Whether we visualize world history or company milestones, a good graphic depiction of key events over time is vital for the understanding of our narrative. To support this need, our Timeline template offers a seamless way to visualize any sequence of events in a beautiful and interactive way. Simply input your dates and images, choose from different layouts and you’re all set.
The Timeline template is one of our premium templates, available to users on our Business plans. Get in touch with our sales team to learn more.
What is a timeline chart?
Timeline charts visually depict a series of events in chronological order. Generally, you can create a timeline of anything that happens over time, both in the past and in the future. Unlike the Gantt Chart, the Timeline template aims to provide a more general overview of events and focuses on the main milestones.
Timelines have existed for thousands of years – ever since ancient chroniclers and historians sought ways to chronologically depict information. Although Joseph Priestley’s A New Chart Of History is considered the “most influential timeline of the 18th century” and pioneers the use of this chart type in studies, timelines have actually been used by society for much longer. The Book of Genesis, for instance, can serve as an early example of our love towards timelines, as it details the creation of the world and humanity in chronological order.
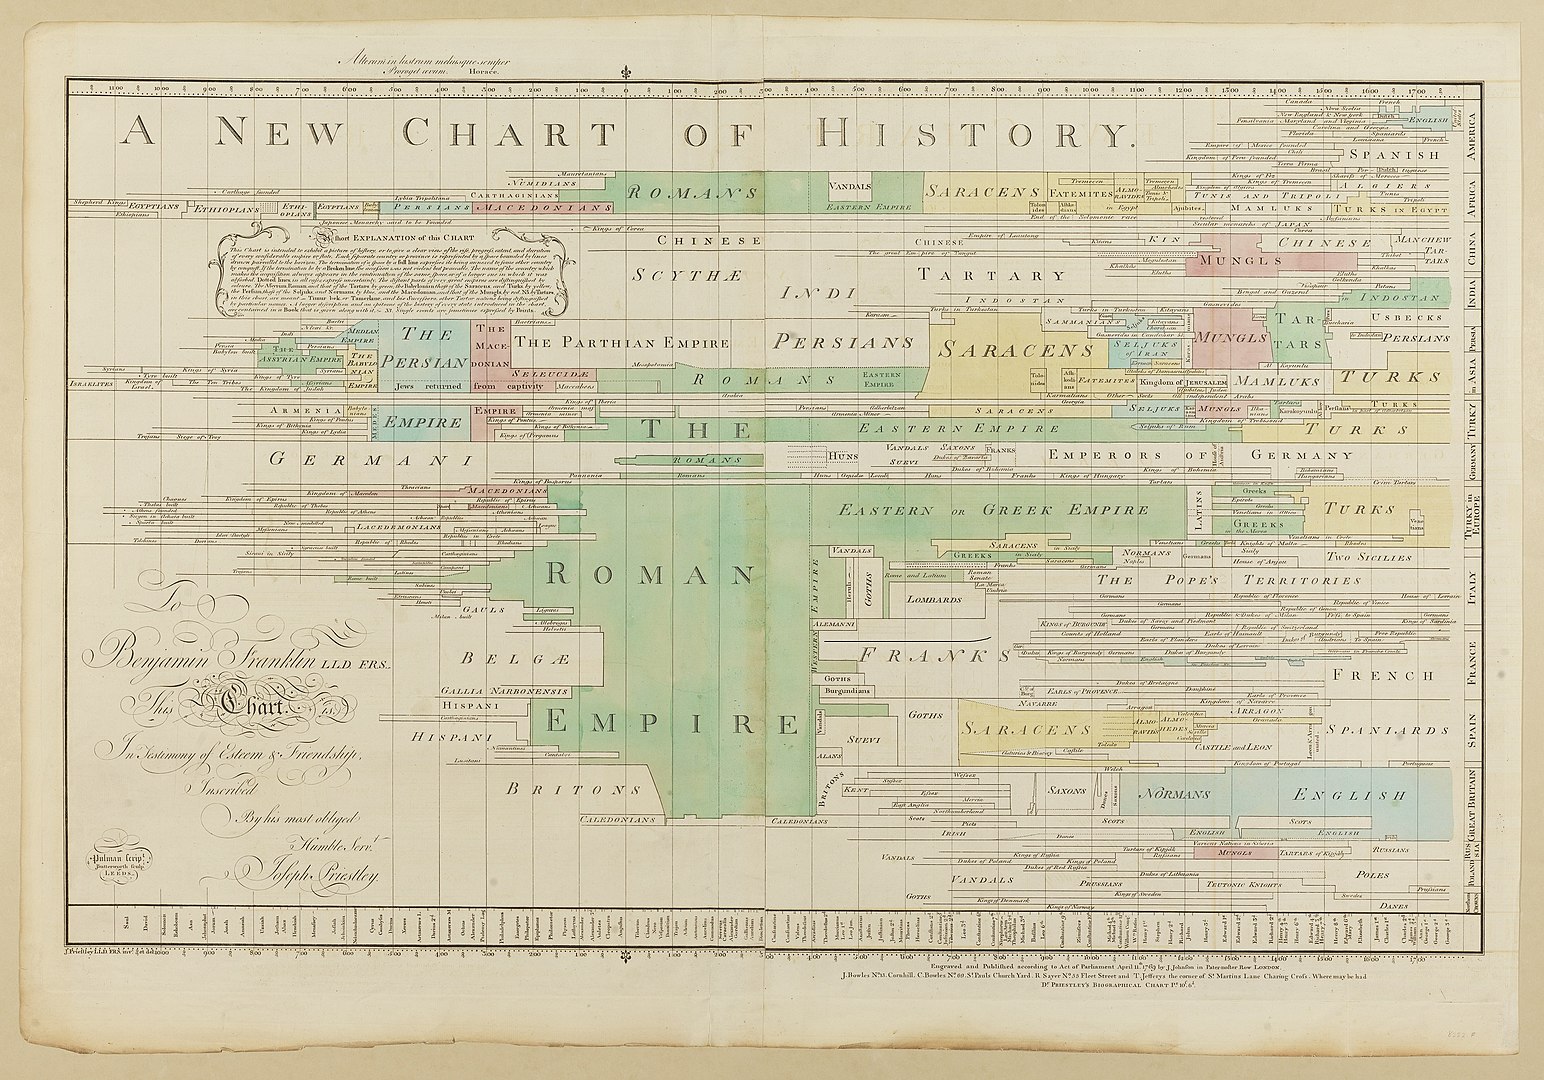
Joseph Priestley's A New Chart of History (1769). Wikipedia
The main purpose of the timeline is to contextualize a story or a concept in a clear chronological order. It can provide the viewer with a quick but comprehensive glimpse at a sequence of events – regardless of whether you visualize the ancient past or project timeframes. Below is an example that visualizes the story of Flourish.
How to make an interactive timeline with Flourish
As with all Flourish templates, this one has several customizable settings for you to choose from. You can change the orientation of your timeline with one simple click, and you can easily adjust the timeline scale of your events to be equidistant or accurately representative of the time scale. See the story below to compare how the different layouts work in practice!
To get started, you only need a column containing the Start time of all your events and their Title. You can also have an optional column for the End time, which will determine the length of your markers when in Time scale positioning, for a more accurate depiction of the duration of each event. You’ll notice that when choosing this mode, a customizable axis will appear, too.
The Timeline template also includes one of our most exciting Flourish features yet – the auto-set of columns in the Data tab! In order to make the process of creating a visualization more efficient, the template now interprets the dataset you upload, works out the data type each column includes (this could be text, numbers or dates) and automatically binds columns under the most appropriate settings.
Tips to make your timeline stand out
Wondering how to transform your timeline from merely informative to totally eye-catching? It’s all about the little touches, like picking the perfect images and tweaking how your audience moves through the events.
Enrich your narrative with images
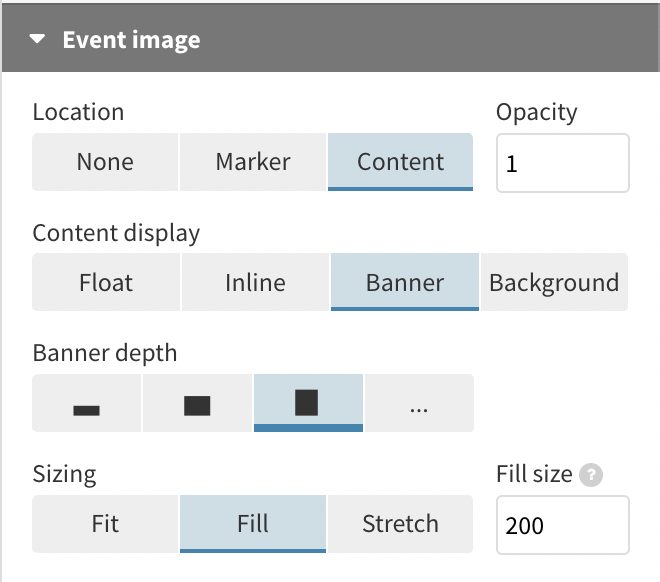
The Timeline template allows you to add an image for each event, with the option to upload different images for the marker and background. Upload your own files or simply paste an URL in each cell that links to the desired image.
Under Event image, you can choose the location and display of your selected photos. Whether you showcase them in their full glory or as non-intrusive markers, the comprehensive image settings of the Timeline template will ensure your visualization stands out in the best possible way.
Ensure your timeline is mobile-friendly
If your visualization seems to stretch too long on smaller screens, don’t worry – Flourish’s Timeline template is here to help you fine-tune the display.
Dive into the height mode settings in the Preview tab to optimize your timeline’s appearance across devices.
Here, you can embrace the flexibility of the custom Aspect ratio feature, which lets you specify separate visualization heights for desktop and mobile. And for that final touch of assurance, make use of the mobile preview option in the top left-hand corner to get a sneak peek of your timeline’s mobile view before you publish!
It’s about time you create your first Flourish timeline! Read our help doc for more info.