How Tortoise & Sky News built a powerful data exploration tool with the Flourish SDK
Learn how the two newsrooms used Flourish to create the Westminster Accounts, an innovative data exploration platform
“News organizations often struggle with highly complex Content Management Systems that make it challenging to create interactive stories. However, the Flourish SDK is a great back door to CMSs and makes it possible to do cool data and visual journalism.” – Katie Riley, Data editor at Tortoise
Created with Flourish, the Westminster Accounts is the first fully searchable database of the money flowing into British politics. Created by Tortoise and Sky News, it reveals the fascinating world of financial contributions in the realm of politics.
To ensure a user-friendly experience, the brilliant team behind this project designed a custom experience using the Flourish SDK, making even the most intricate data easily understandable for all.
The story behind the new tool
Tortoise is a slow news organization based in the UK that focuses on news stories with an in-depth lens. Driven by the lack of comprehensive data on the money going into British politics, Tortoise partnered with Sky News to collate, analyze and put together data from various public sources.
The tool allows you to explore a MP's and their parties' earnings
They created an interactive and searchable online tool that shows how money flows in the UK’s political system.
The Westminster Accounts allows users to search by an MP’s name or a voter’s postcode, providing valuable information such as MPs’ earnings beyond their taxpayer-funded salary, the top earners in parliament, and the donors supporting individual MPs and political parties.
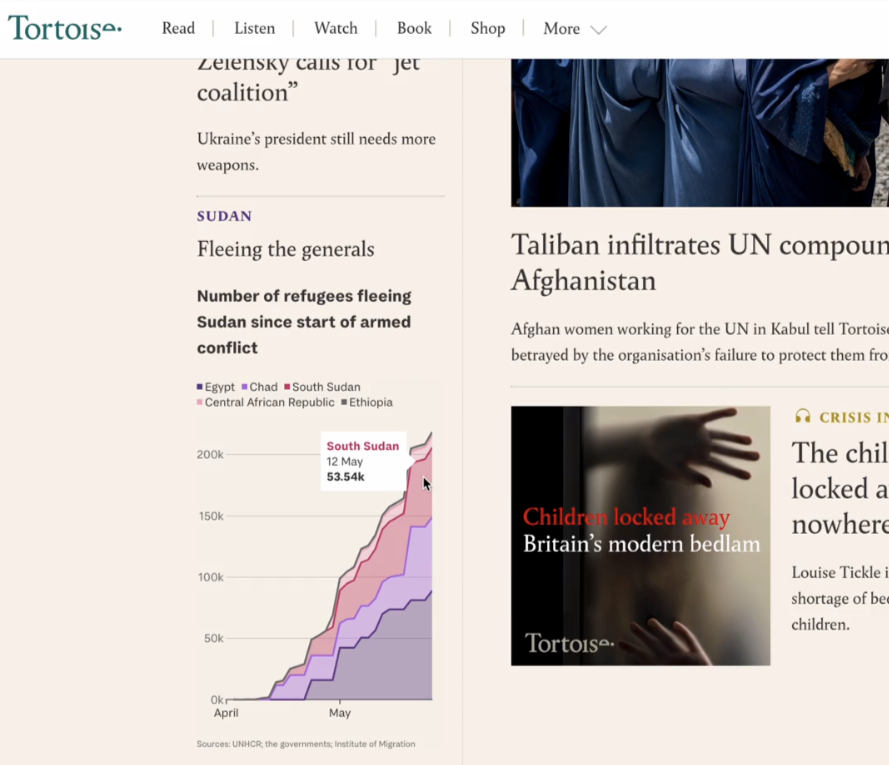
A Flourish area chart on Tortoise's home page
Essentially, the tool makes information about the financial workings of Westminster accessible to all.
Flourish plays a key role in Tortoise’s daily data journalism. “We use Flourish a lot”, says Katie Riley, Data editor at Tortoise. On a daily basis, their homepage comes alive with a captivating display of visual data journalism, usually created with Flourish.
While their day-to-day use of Flourish tends to be focused on a quick turnaround of simple graphics, they knew that for this project they needed a customized way of visualizing their data.
How Tortoise & Sky News created the Westminster Accounts
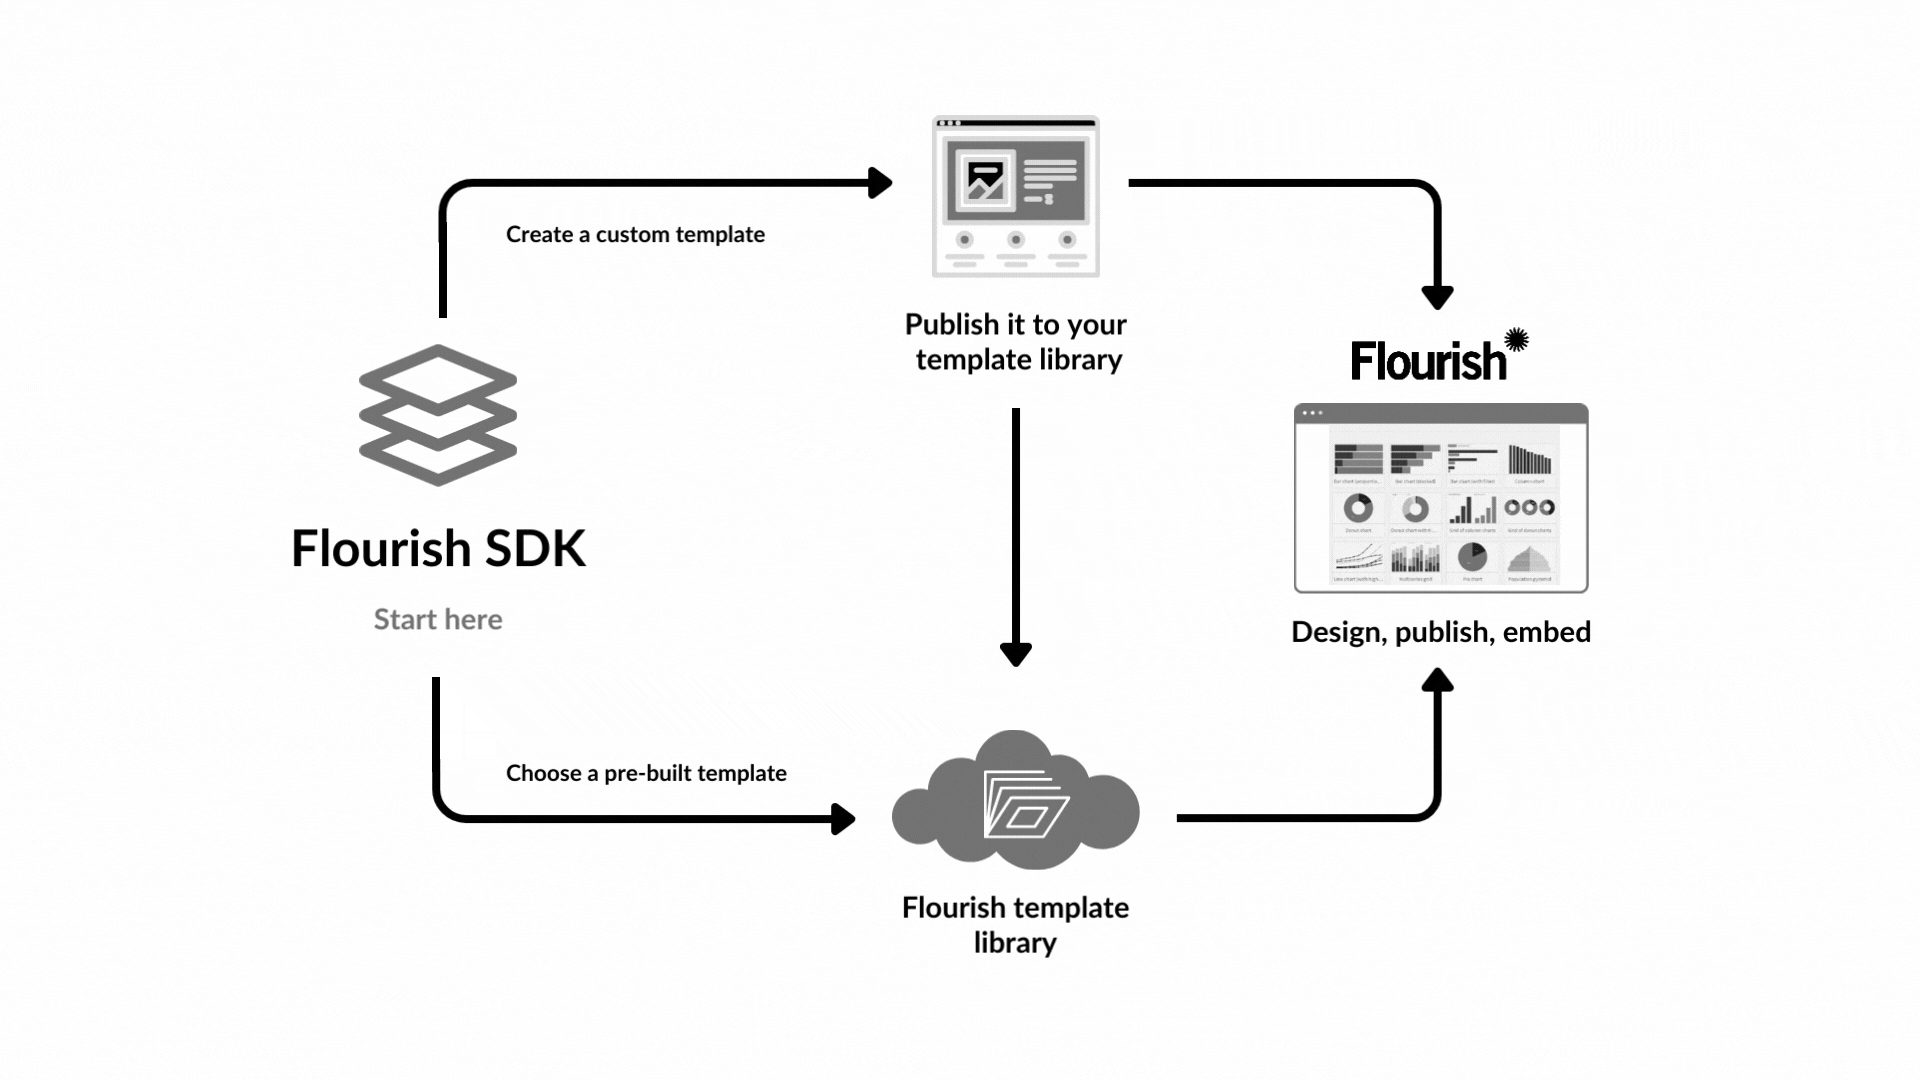
In order to create a more customized solution that went beyond the capabilities of off-the-shelf Flourish templates, the team turned to the Flourish SDK. Our Software Development Kit enables developers to create their own visualization templates and upload them to Flourish. It offers extensive customization and adaptability for custom templates since developers have complete control over the choice of settings and how their data is connected to the template.
To learn more about the Flourish SDK, visit our developer hub
Instead of starting from scratch, the Flourish SDK provides developers with a foundation and framework to build upon when creating new templates. Tortoise and Sky News benefitted from pre-built components, functionality, and design elements through open-sourced modules that allow you to repurpose code snippets, specifically tailored for data visualization. This approach also guarantees that the new template is responsive and easy to embed, in the same way as standard Flourish visualizations.
Since the Westminster Accounts involved collaboration between two different newsrooms with distinct branding guidelines, the SDK proved particularly useful. The custom template was built with two separate styles for each newsroom, including different links and thumbnails, so they could easily switch between them via a custom-built setting in the template. This eliminated the need to create two separate templates that essentially fulfilled the same function and instead simplified the process through a single setting.
Katie admits that this innovative approach saved the team months of additional work: “News organizations often have really impenetrable CMSs which make it hard to publish anything custom. Since Sky News is also a big Flourish user, we were both able to use Flourish to build this template and publish it to our websites, which would have otherwise been quite a nightmare.”
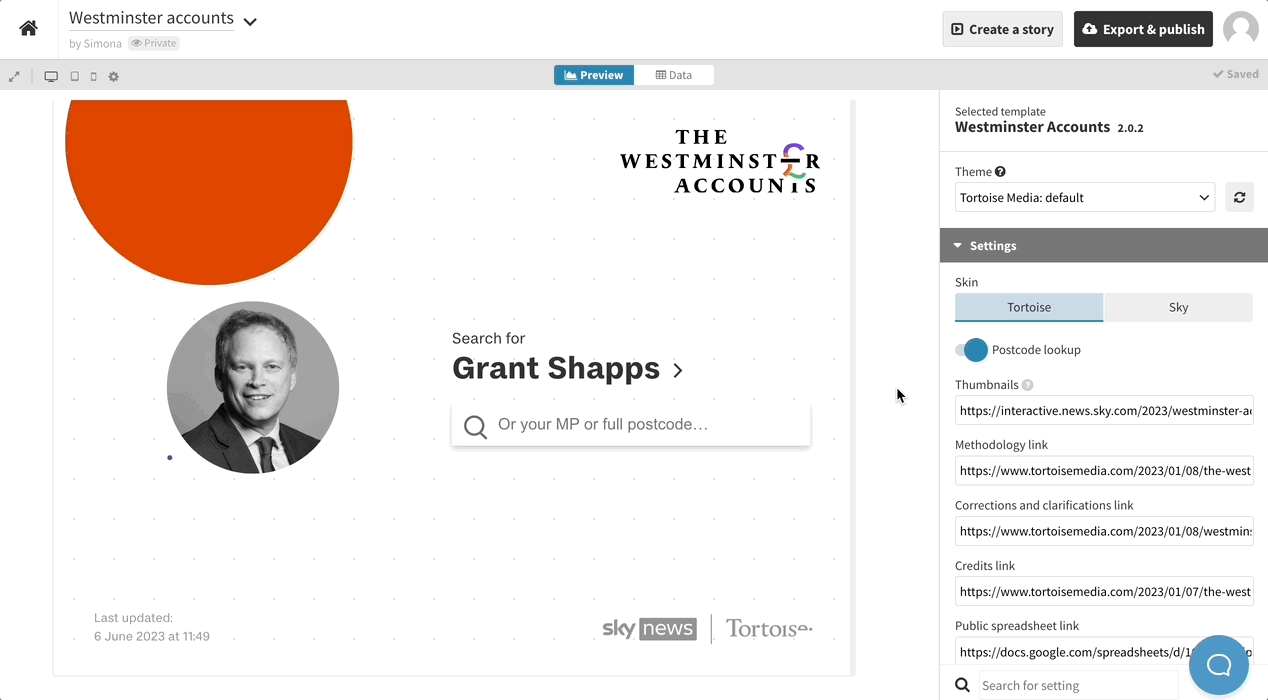
The built-in setting of changing the skin has the power of fully rebranding the appearance of the chart
Given the multiple data sources and the need for quite a bit of data wrangling, Katie and the team required multiple sheets to populate the packed circles and scrollytelling content. If they were to utilize an existing Flourish template, adapting the data to fit a traditional Flourish visualization would have introduced further complexity and challenges into the process.
Thankfully, the Flourish SDK provided the flexibility to tailor the template to fit their own data structure, instead of the other way around. Using multiple tabs in the Data tab, the team was able to utilize various column bindings for their unique needs. They also utilized Flourish’s feature to connect to live data sources, which guaranteed a more reliable version control of new data entries, ensured that the data behind the template is always up to date, and simplified collaboration.
After completing the project, Katie simply needed to publish two versions of the visualization – one for each branding – and share the embed codes with her colleagues from Sky News. The outcome was a first-of-its-kind database that was both easy to embed and access. “The Flourish SDK is a great back door to CMSs and makes it possible to do cool data and visual journalism”, says Katie.
Leveraging data-driven journalism
One of the standout features of the Flourish SDK is its ability to empower users to create data visualizations that can be saved and reused within their organization. It also opens up exciting possibilities for pushing the boundaries of standard features and venturing into new creative directions – something that many Flourish users, such as Moody’s, Code for Africa, and Nikkei benefitted from.
As highlighted earlier, the team at Tortoise also favors the option to connect to live data sources, which enables the automatic republishing of visualizations. This feature significantly speeds up the process of updating charts and proves to be a game-changer for newsrooms that require timely updates, especially during events like elections or large-scale sports reporting. “This means that you can push stuff to Google Sheets and then you don’t have to go back to Flourish necessarily to update it”, Katie says.
To learn how other Flourish users get the most out of our tool, read some of our case studies below.