Nonprofits
Transform complex data into memorable stories with Flourish – your go-to platform for intuitive data visualization and storytelling.
Inspire action, one data story at a time
Ready to showcase your impact? Flourish empowers changemakers to transform any data into powerful visual narratives. Use interactive data storytelling to build trust and engage your community, from sponsors to beneficiaries.
How Flourish works
Pick a template
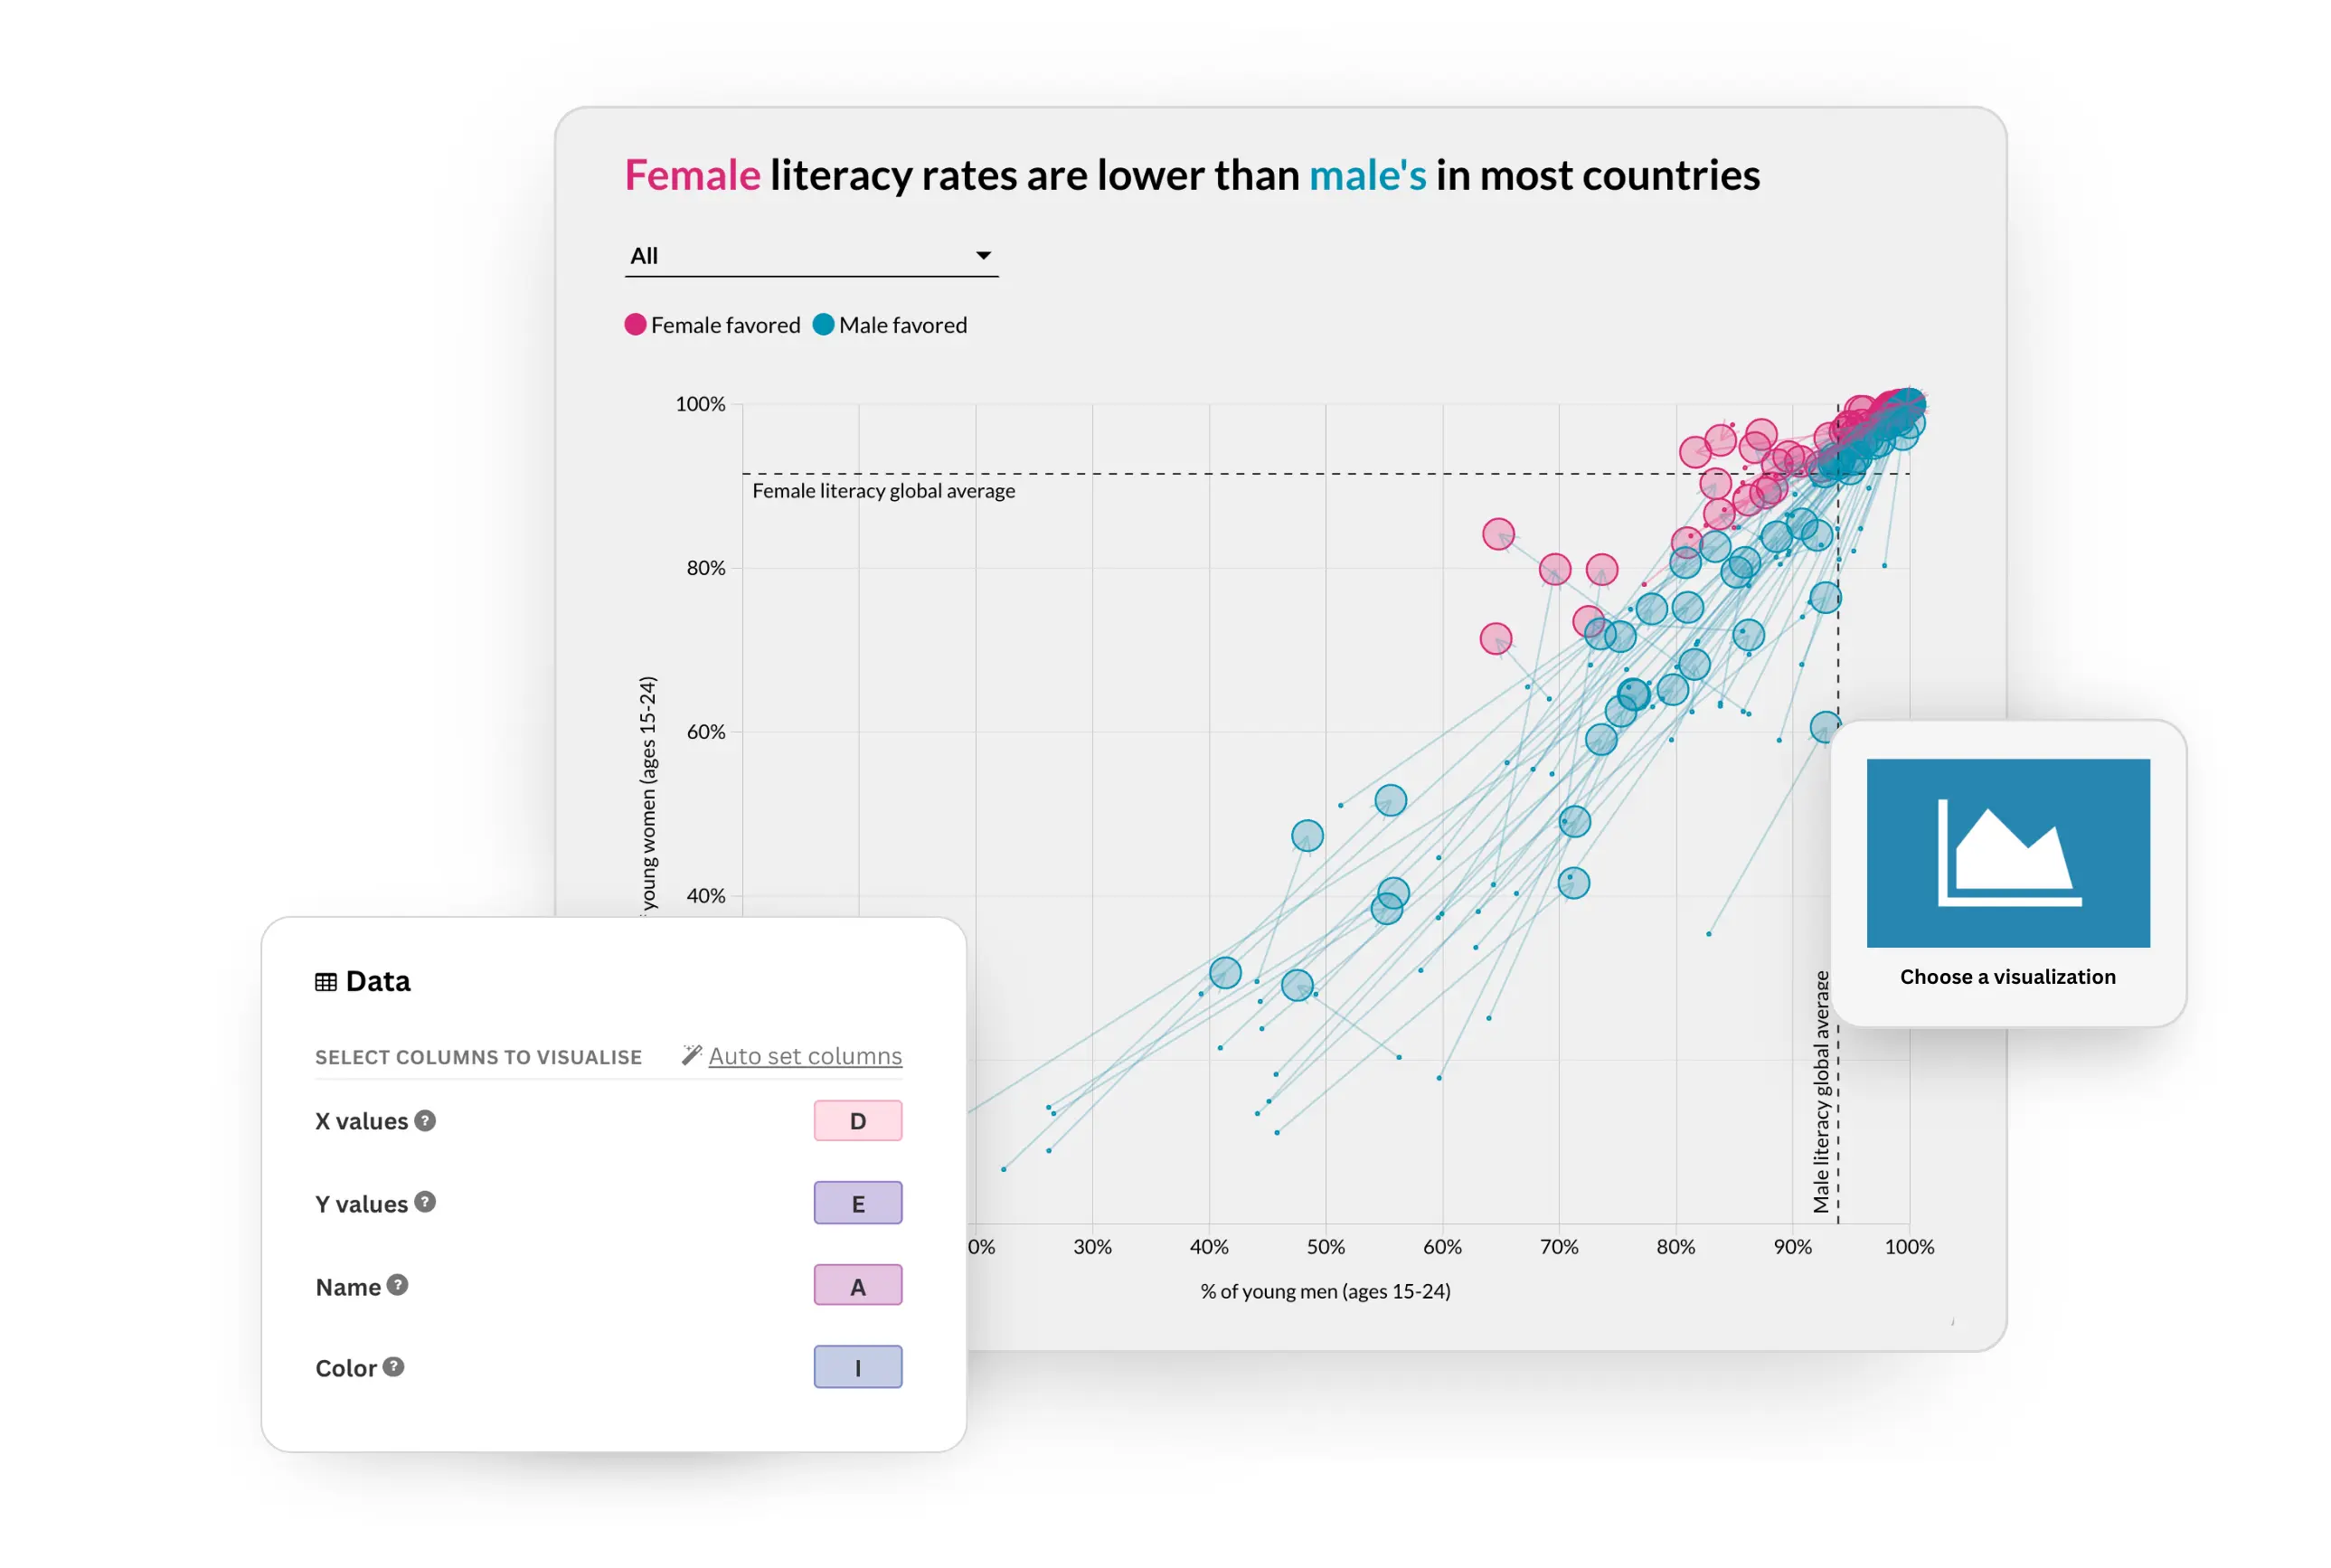
Explore over 40 no-code charts, maps and interactive templates. Effortlessly turn raw data into impactful stories that perfectly reflect your mission.
Refine and collaborate
Make your visuals more engaging with animations and interactive features. Collaborate easily with team folders and sharing permissions.
Publish anywhere
Embed your visualizations into decks, websites, or as standalone graphics. Inspire your audience on every channel with clear, memorable visuals.
Your data, your story, your way
Our intuitive interface equips you with everything you need to design stunning data stories – quickly, easily, without coding. Looking for more control? No problem! Our API offers advanced customization for tasks like automated processes and handling large datasets.

Designed to engage
Break down complex data into clear, accessible narratives that build trust and drive results. Use interactive tools like scrollytelling to communicate key insights. Customize any design element to match your brand and make reports instantly recognizable and professional.
Stunning on any screen
Say goodbye to static PDFs and embrace immersive web stories that bring your data to life. Our fully responsive visualizations embed anywhere and work on any screen, from websites to social media.
Expertise at your fingertips
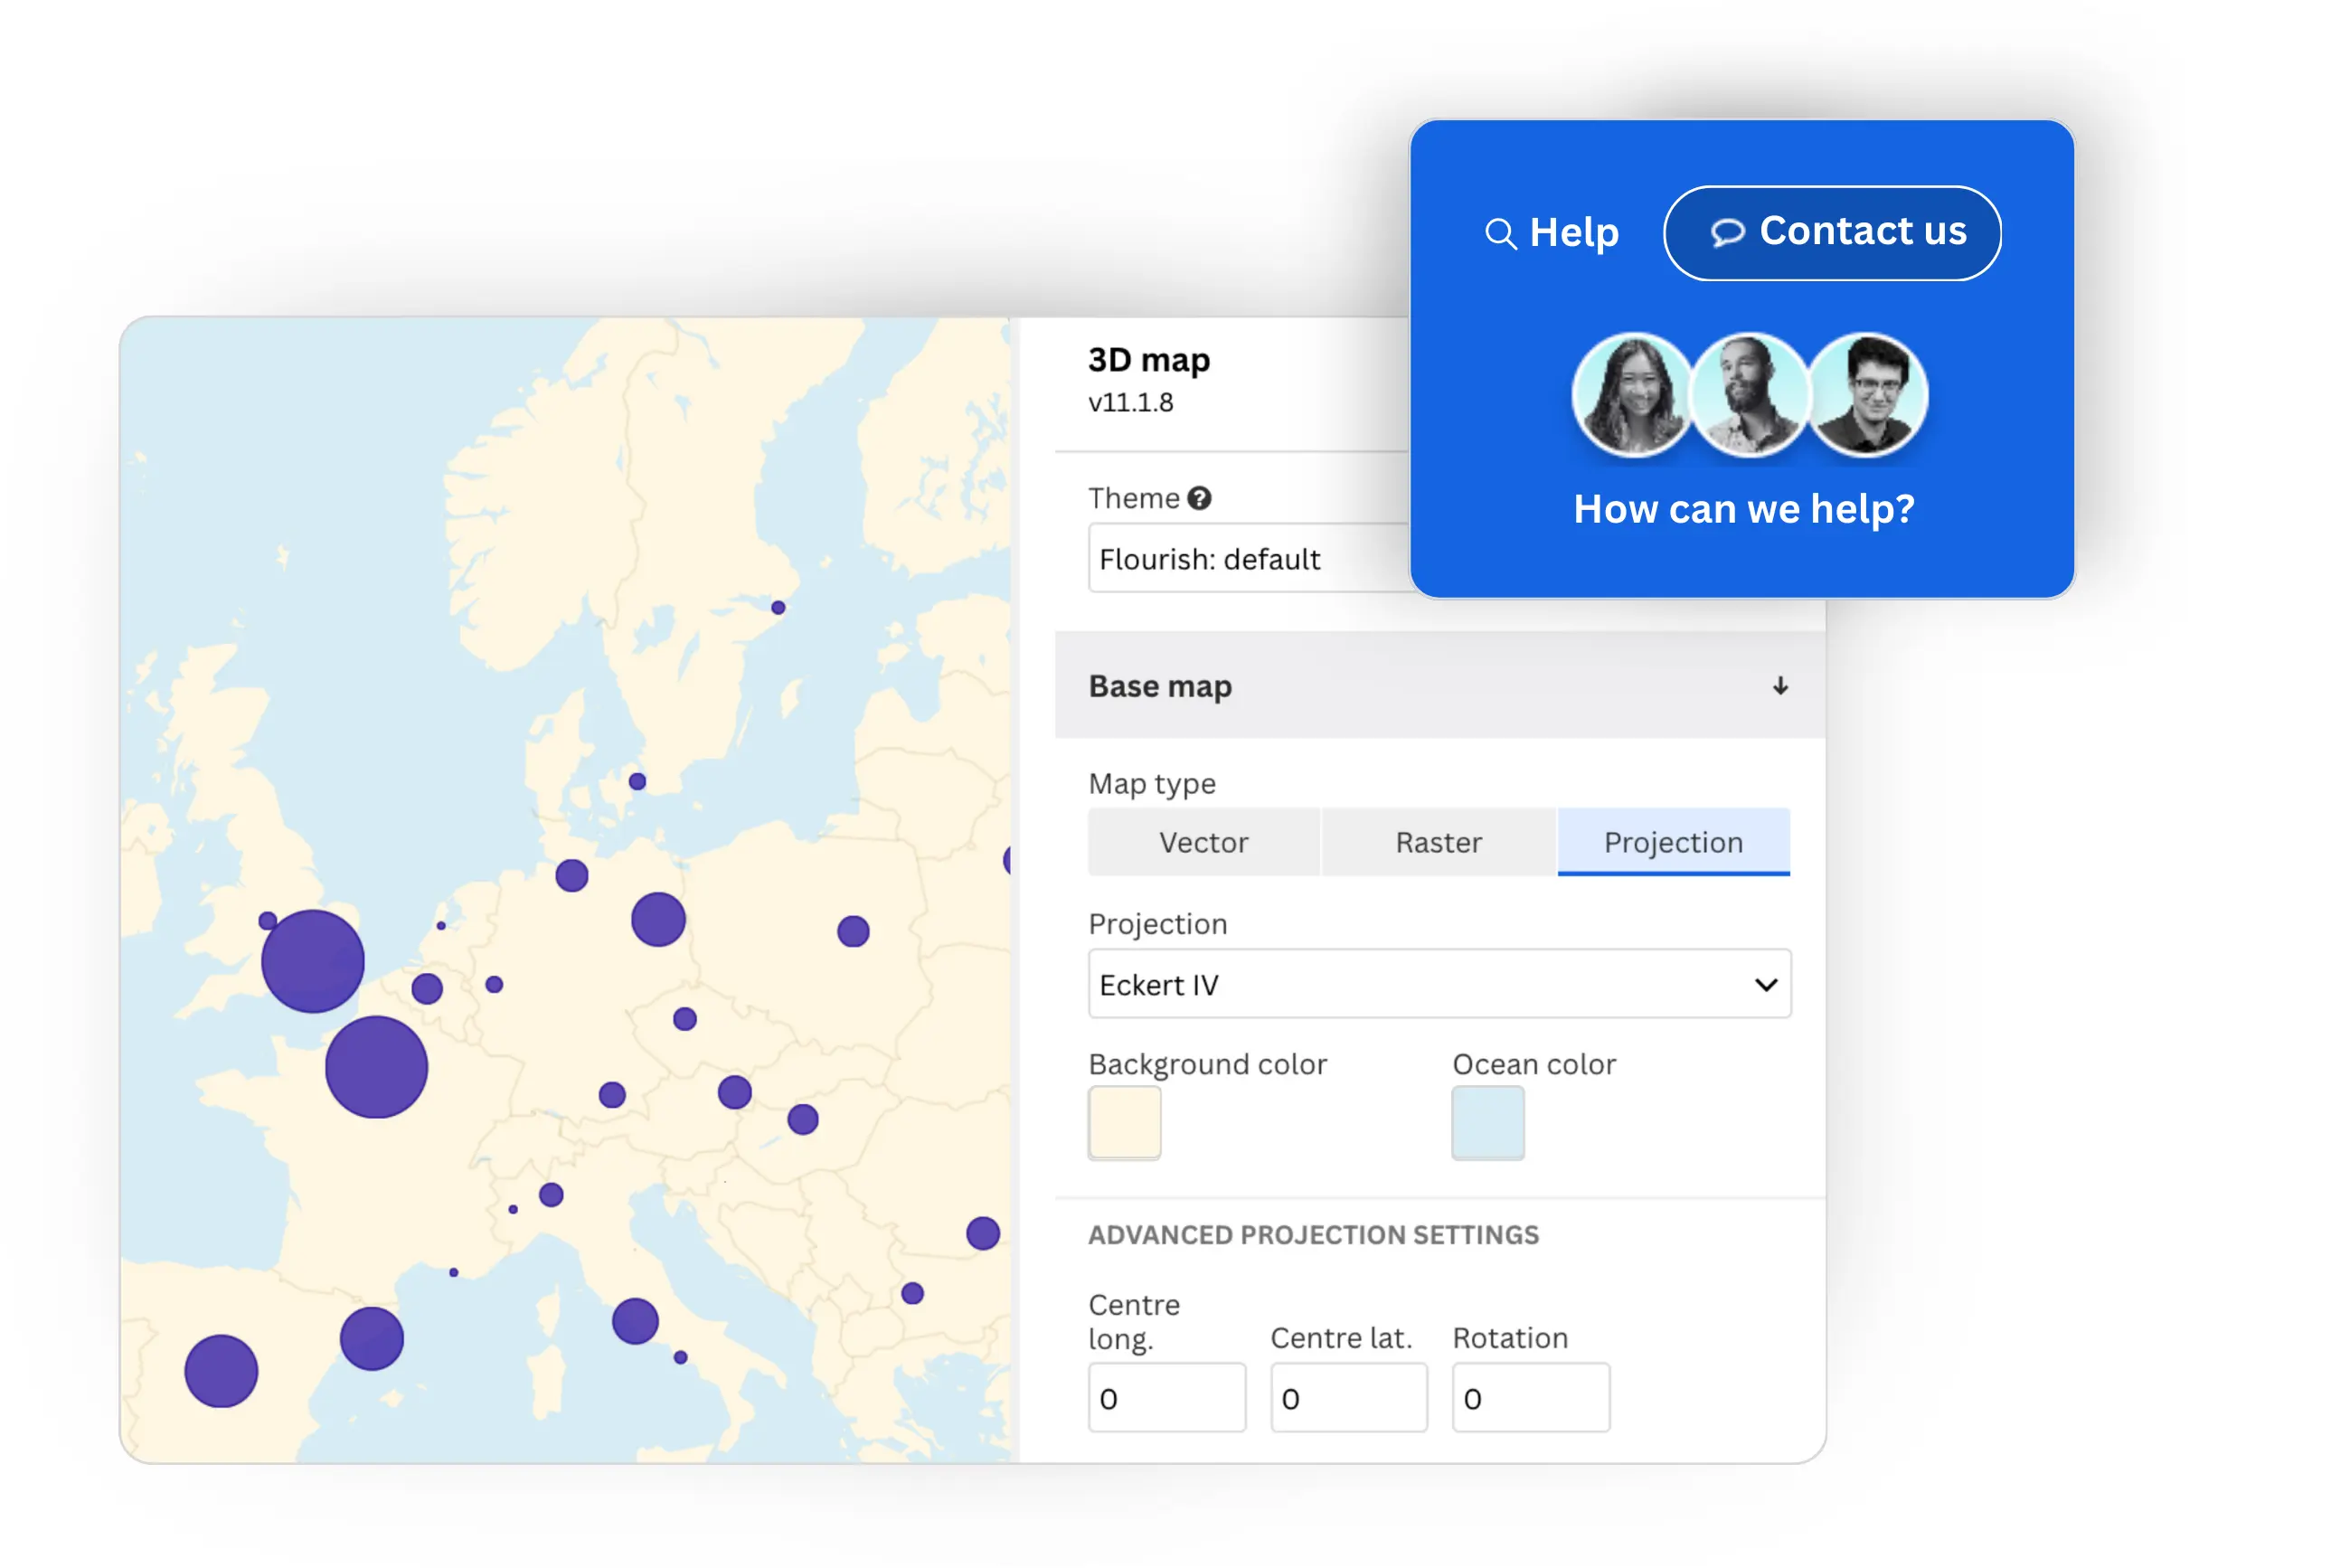
Master data visualization with help from our support team, access to webinars, and step-by-step guides. Our user-friendly platform makes even complex projects manageable, helping you do more with fewer resources.

How we help you drive your mission forward

As part of the Canva family, we share a commitment to making a difference. That’s why we created Data Viz For Good – a program where nonprofit and charity organizations get free, one-on-one support with their data visualizations. You simply provide the data, and our team of experts will handle the rest, turning it into engaging, interactive visuals tailored to your goals.
Periodically, we run workshops in partnership with a selected nonprofit, focusing on a specific dataset or project. After collaborating with us, you’ll receive custom visualizations along with training to easily manage and update them yourself.
We’ve already helped organizations like Prevail Fund, Trussel Trust, and GiveDirectly to create powerful visuals that resonate with their audiences. If your project could benefit from our support, apply below to see if you qualify*. We’d love to help bring your data to life and drive your mission forward!
*All applications are subject to review and Flourish reserves the right to select partners at our discretion.
Flourish allows our donors to access a richer level of information about their impact on people living in poverty. Their design templates allow for much needed context and transparency.”
Tyler G Hall, Communications Director, GiveDirectly
I didn’t realize data could be so engaging and beautiful. And of course, more than just beautiful – some of these visualizations aid with new strategic ways to comprehend information.”
Prevail Fund


