Where data meets storytelling
Create stunning charts, maps and interactive content that engage and inspire – instantly. No coding required.
Trusted by leaders worldwide to reach audiences of millions every day
Turn data into stories worth sharing
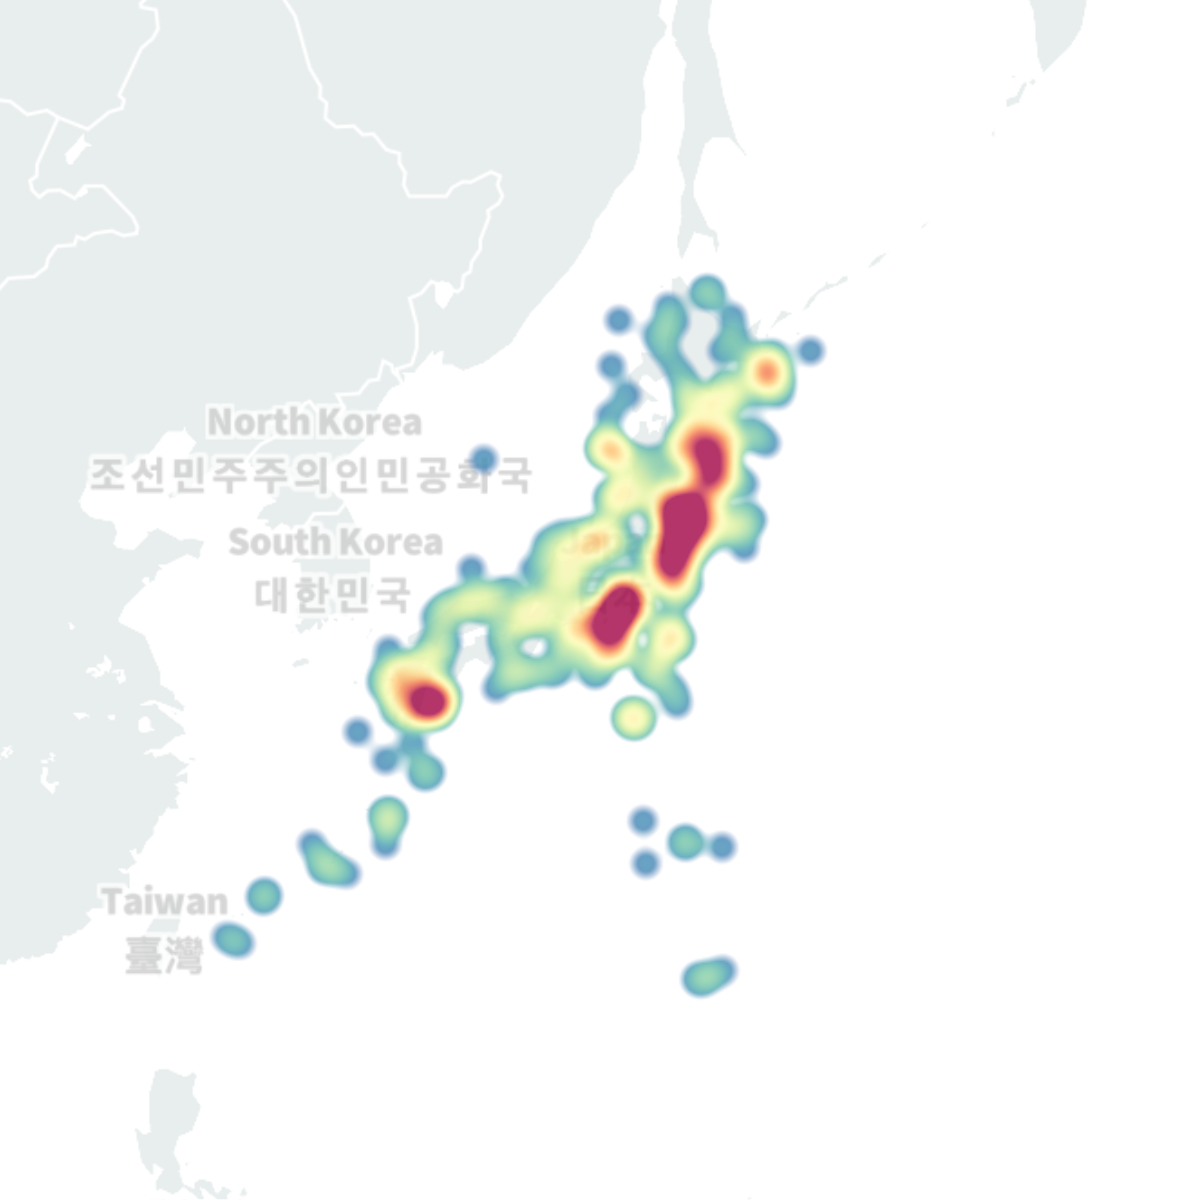
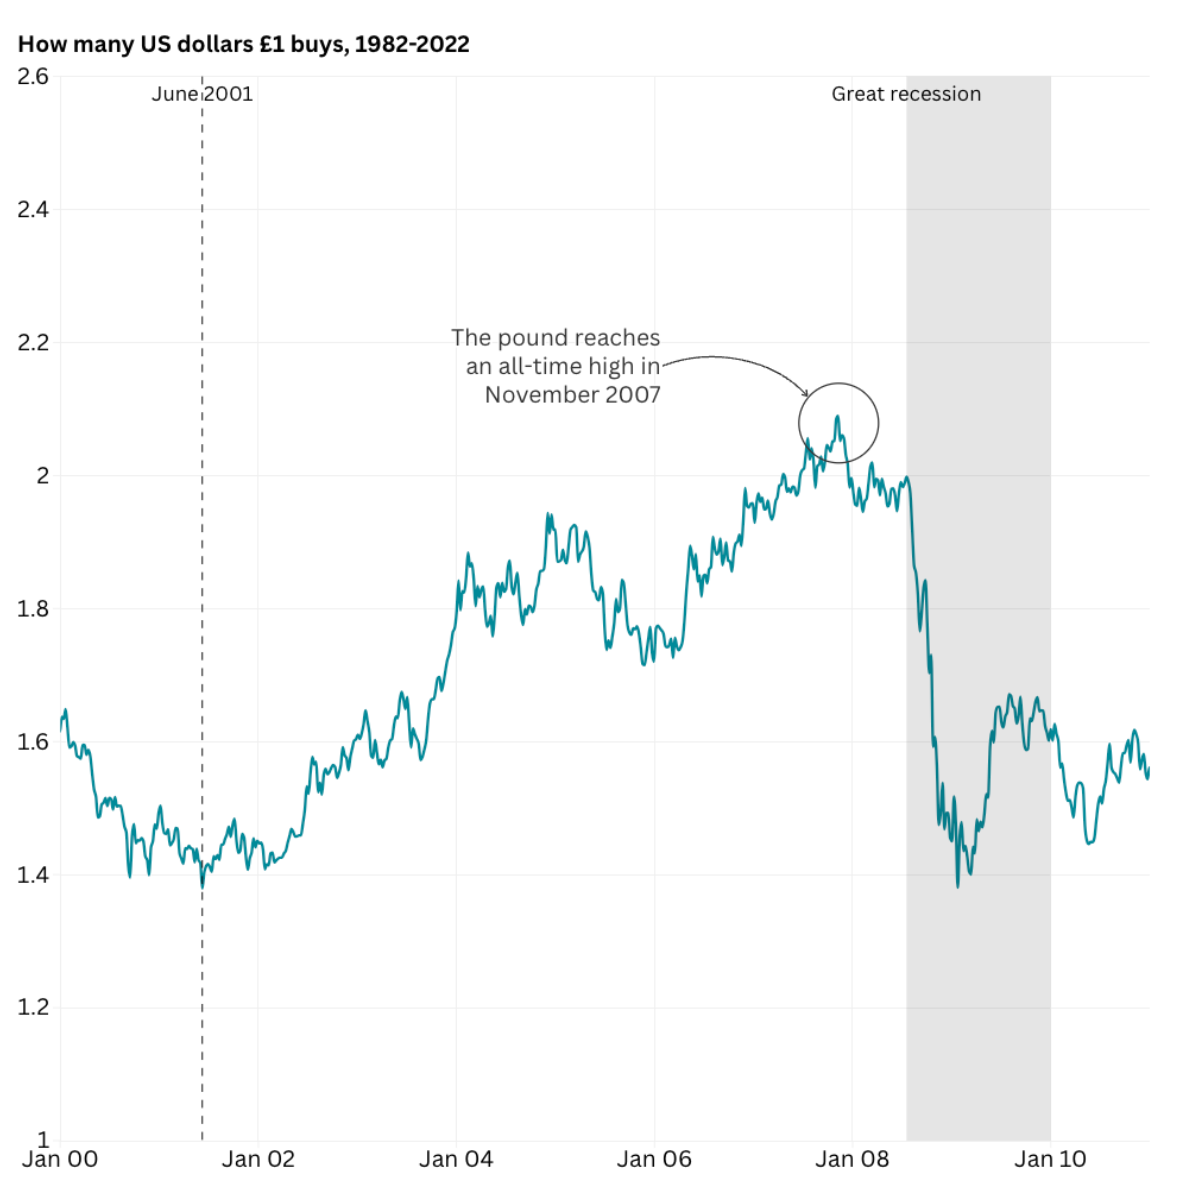
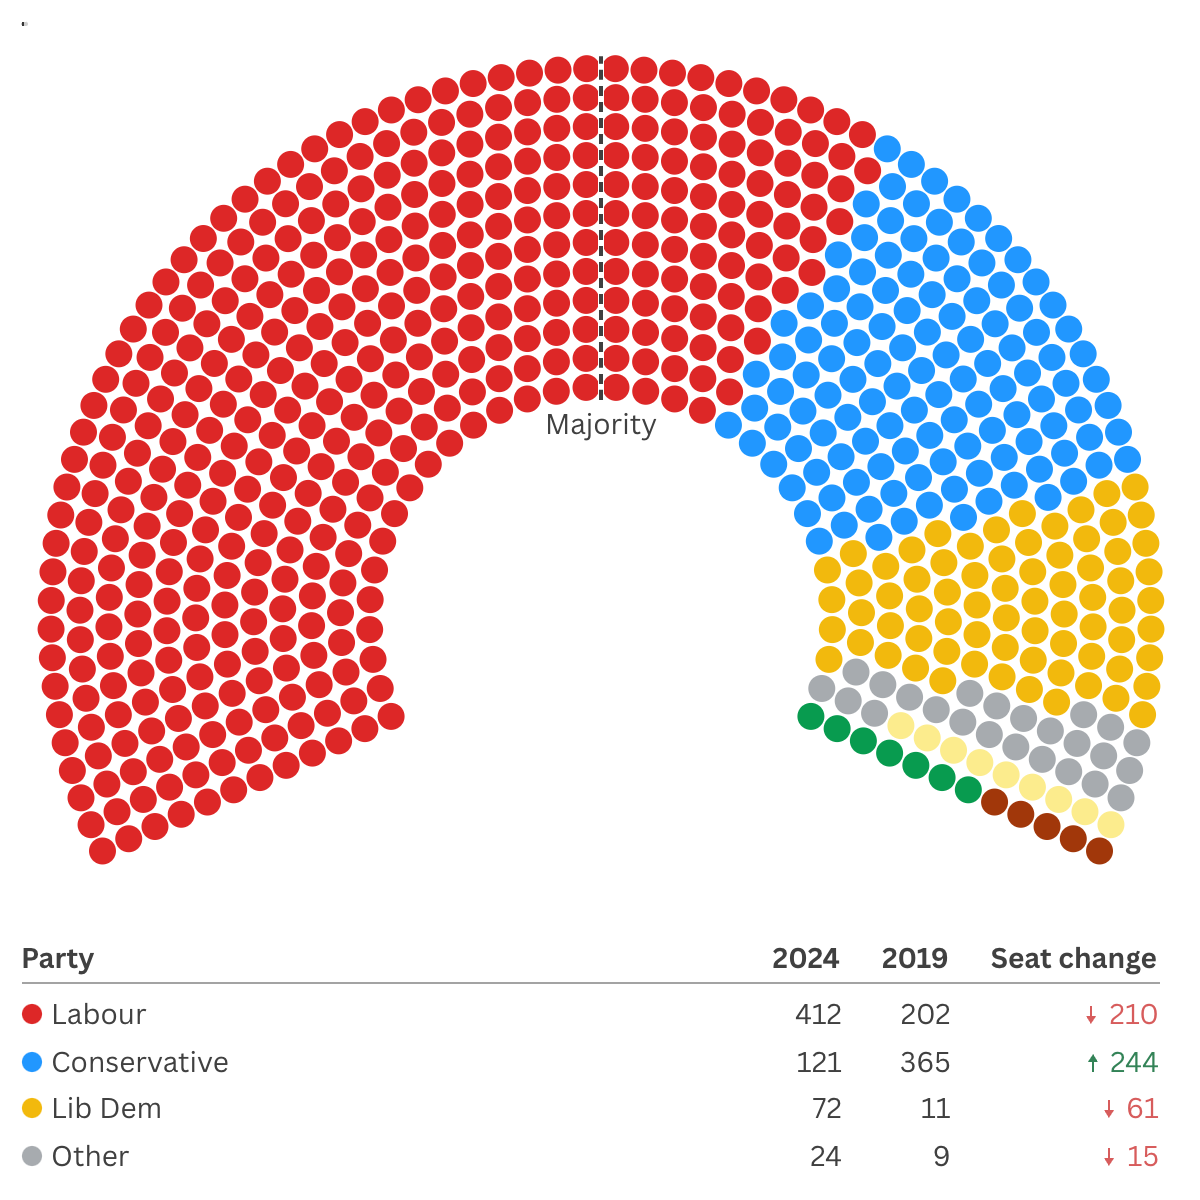
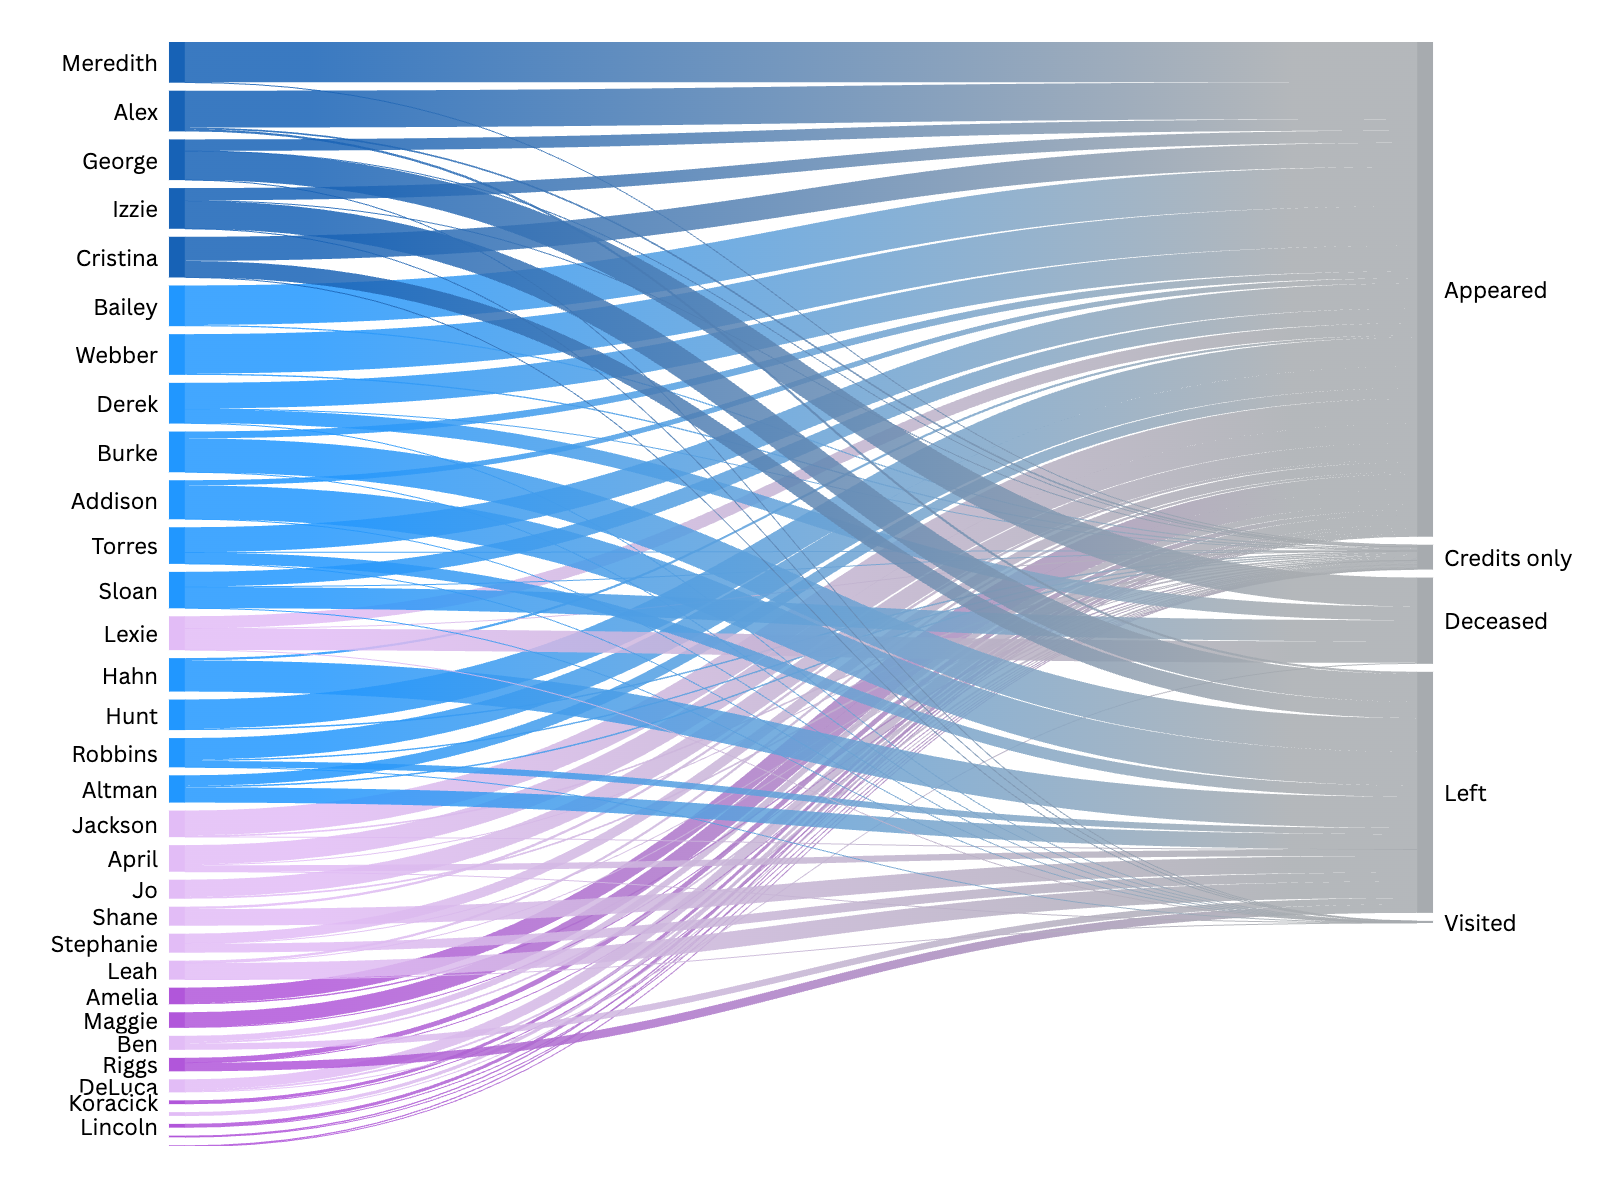
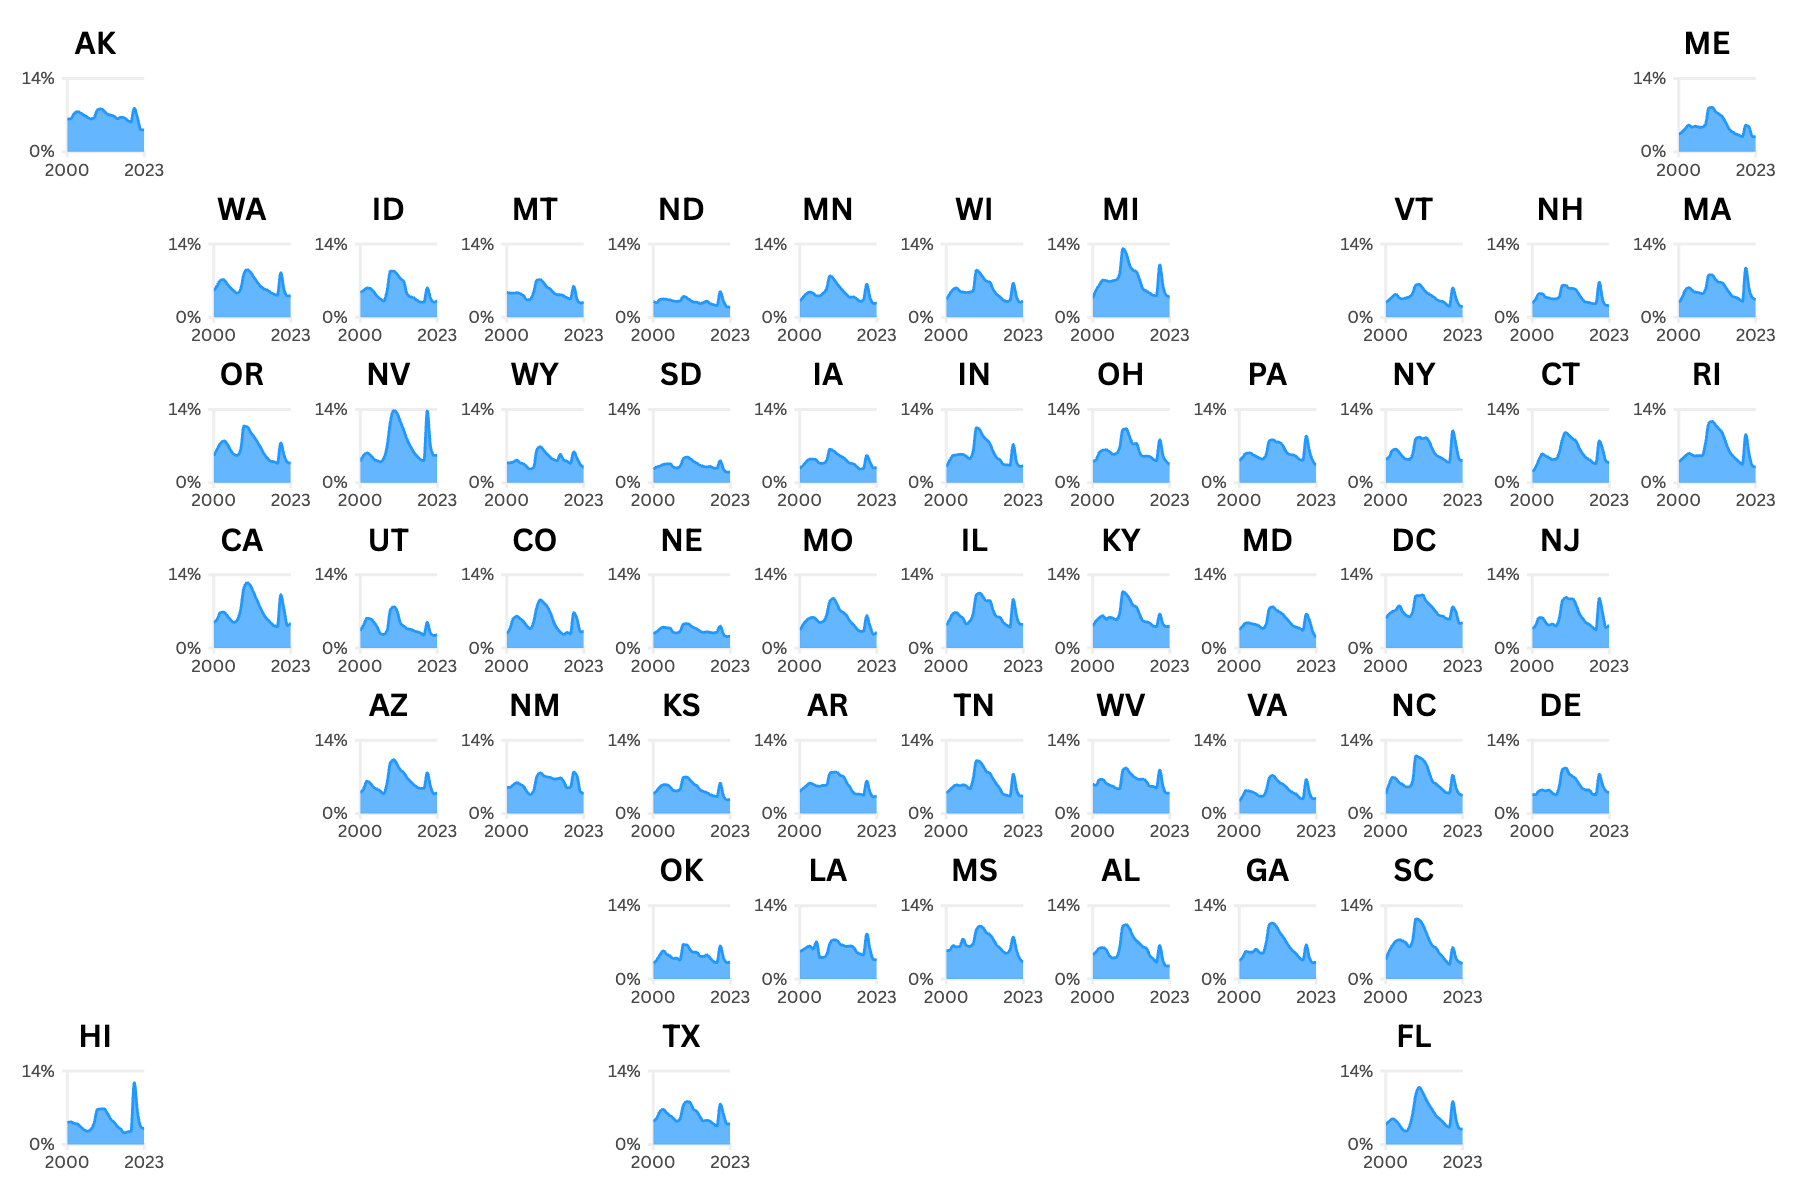
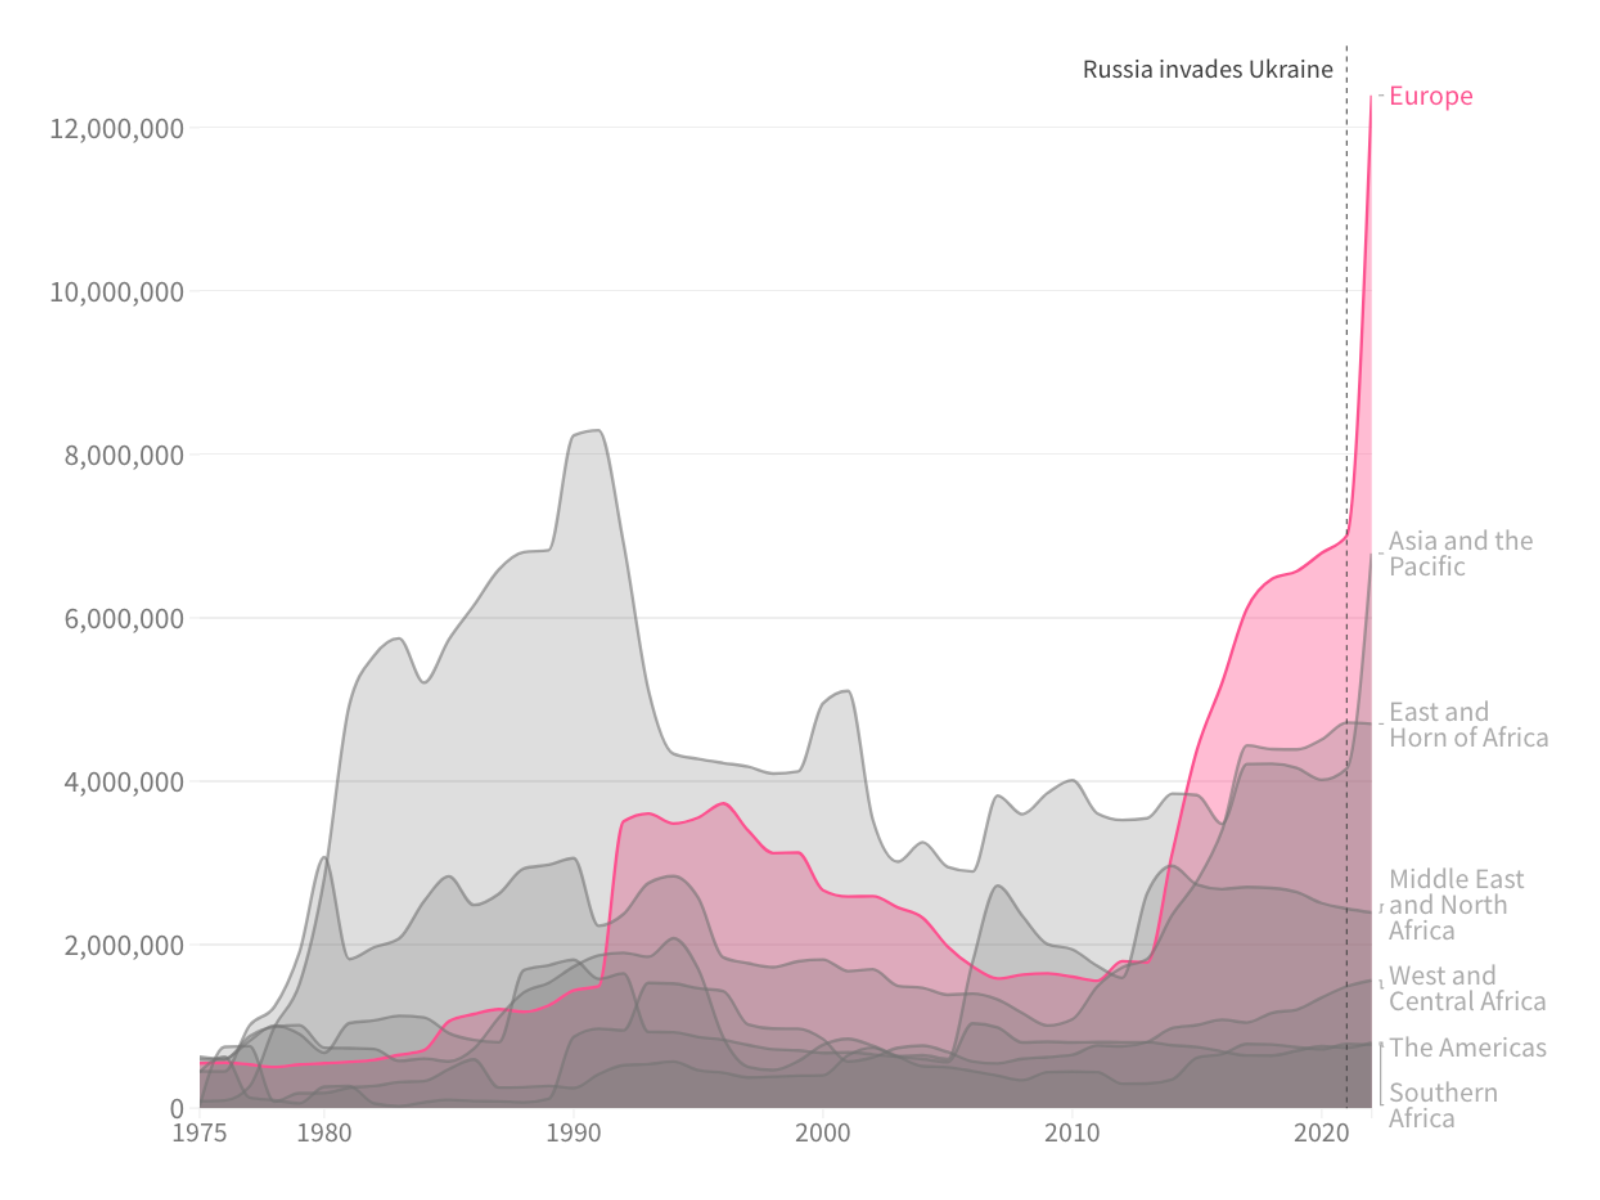
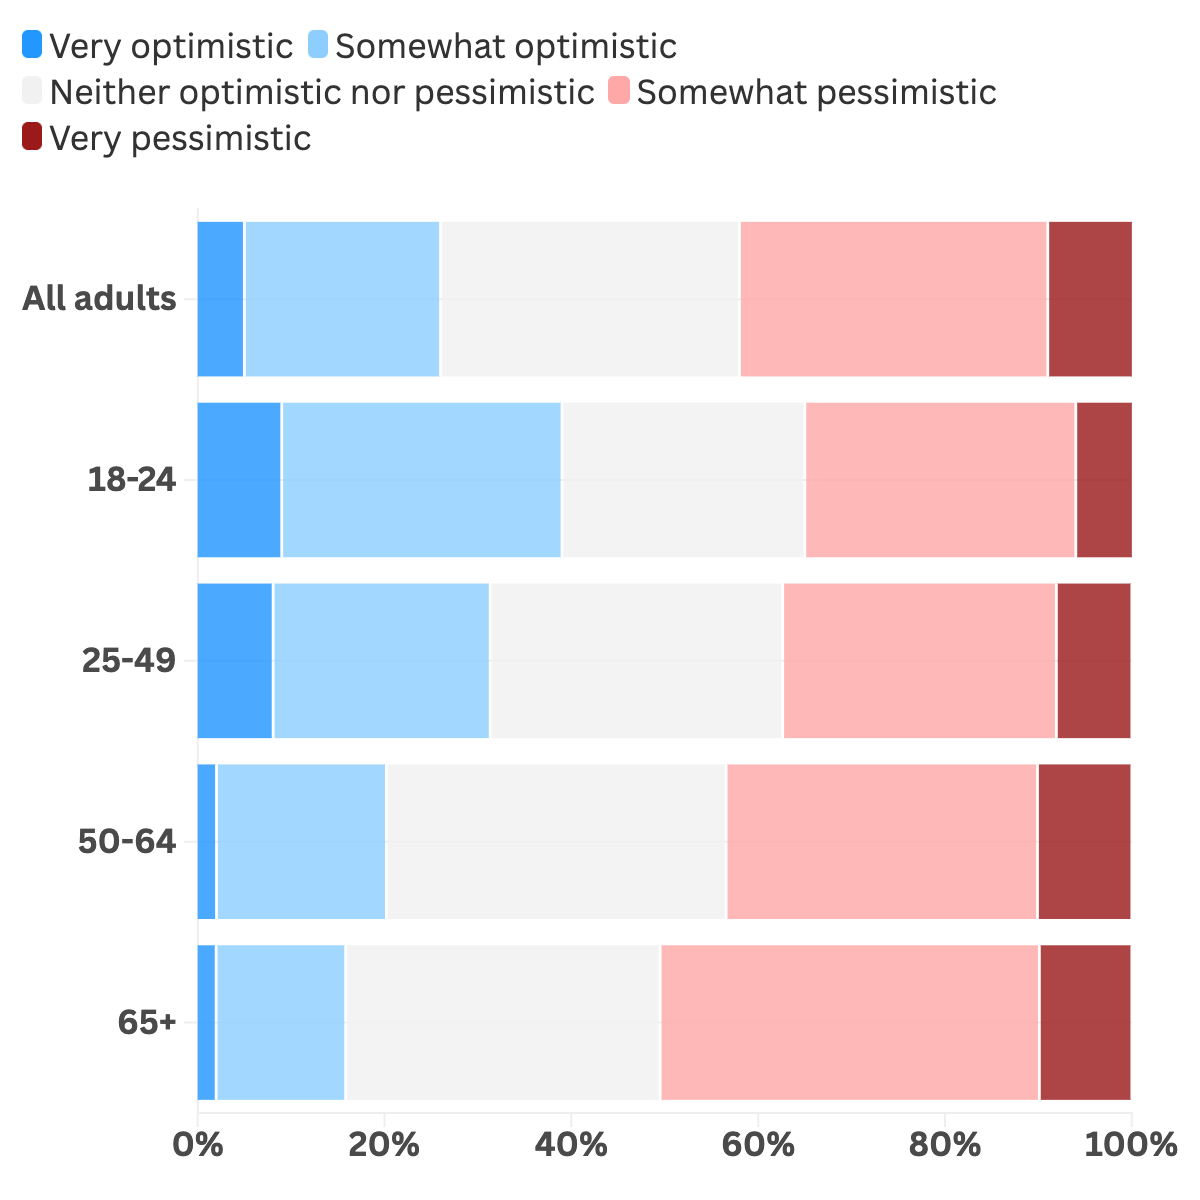
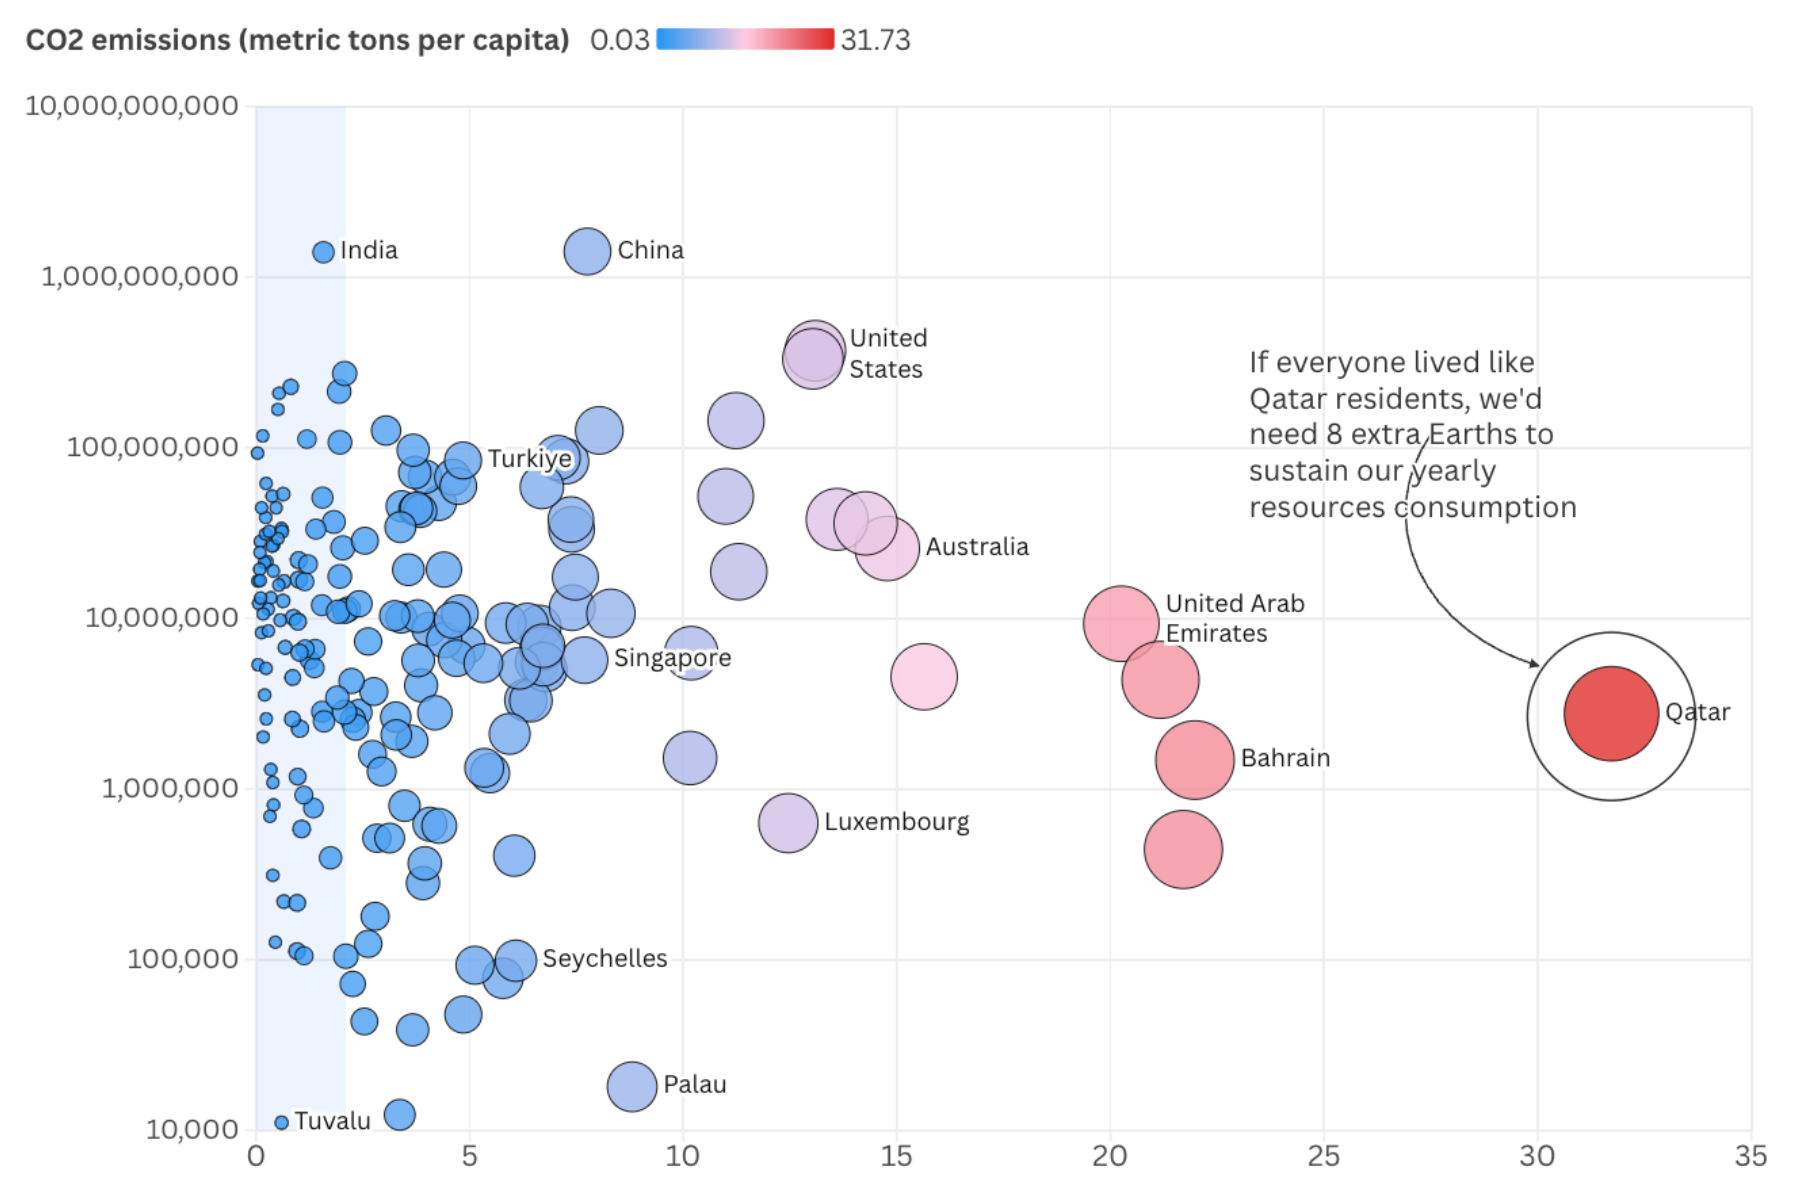
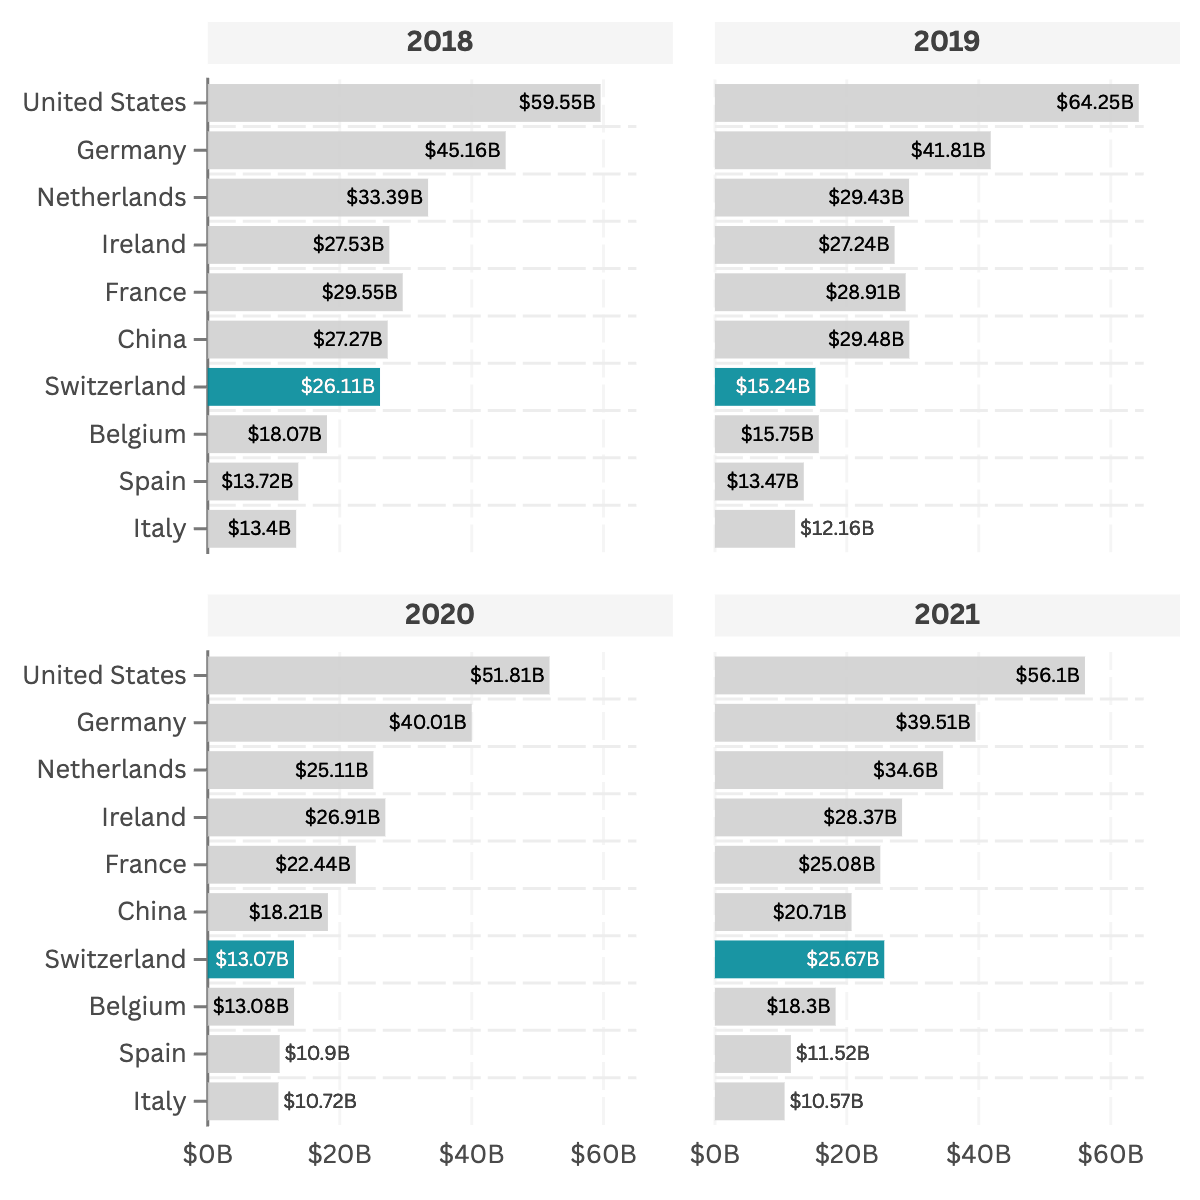
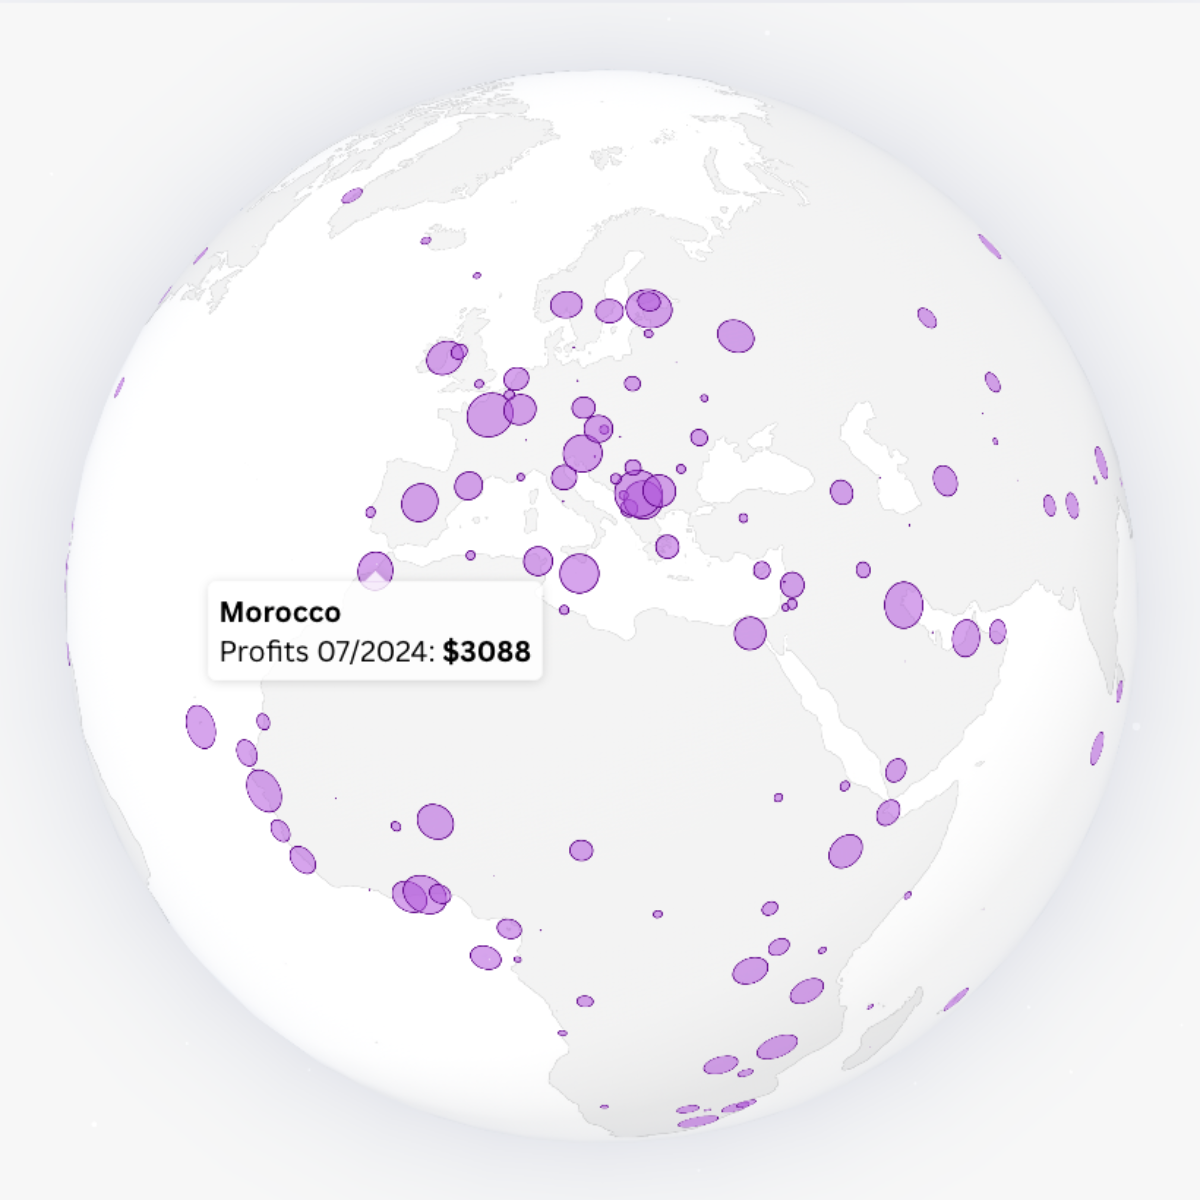
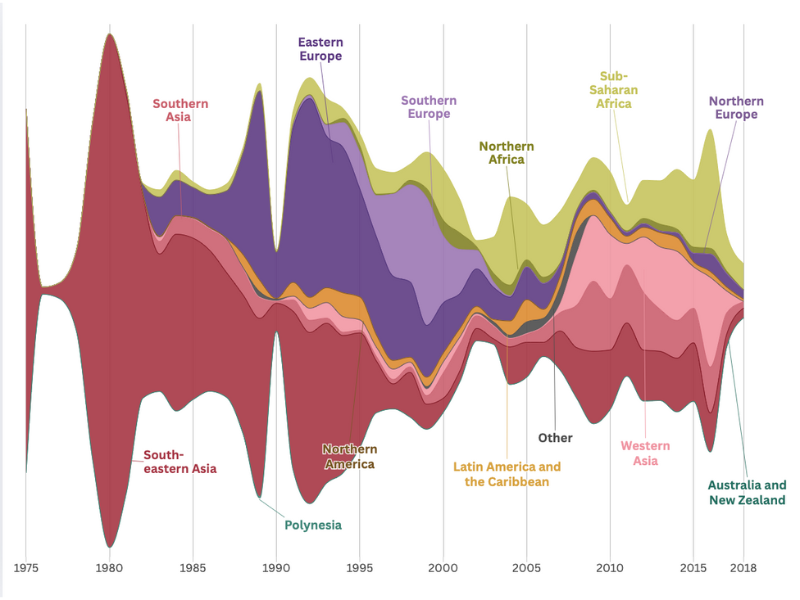
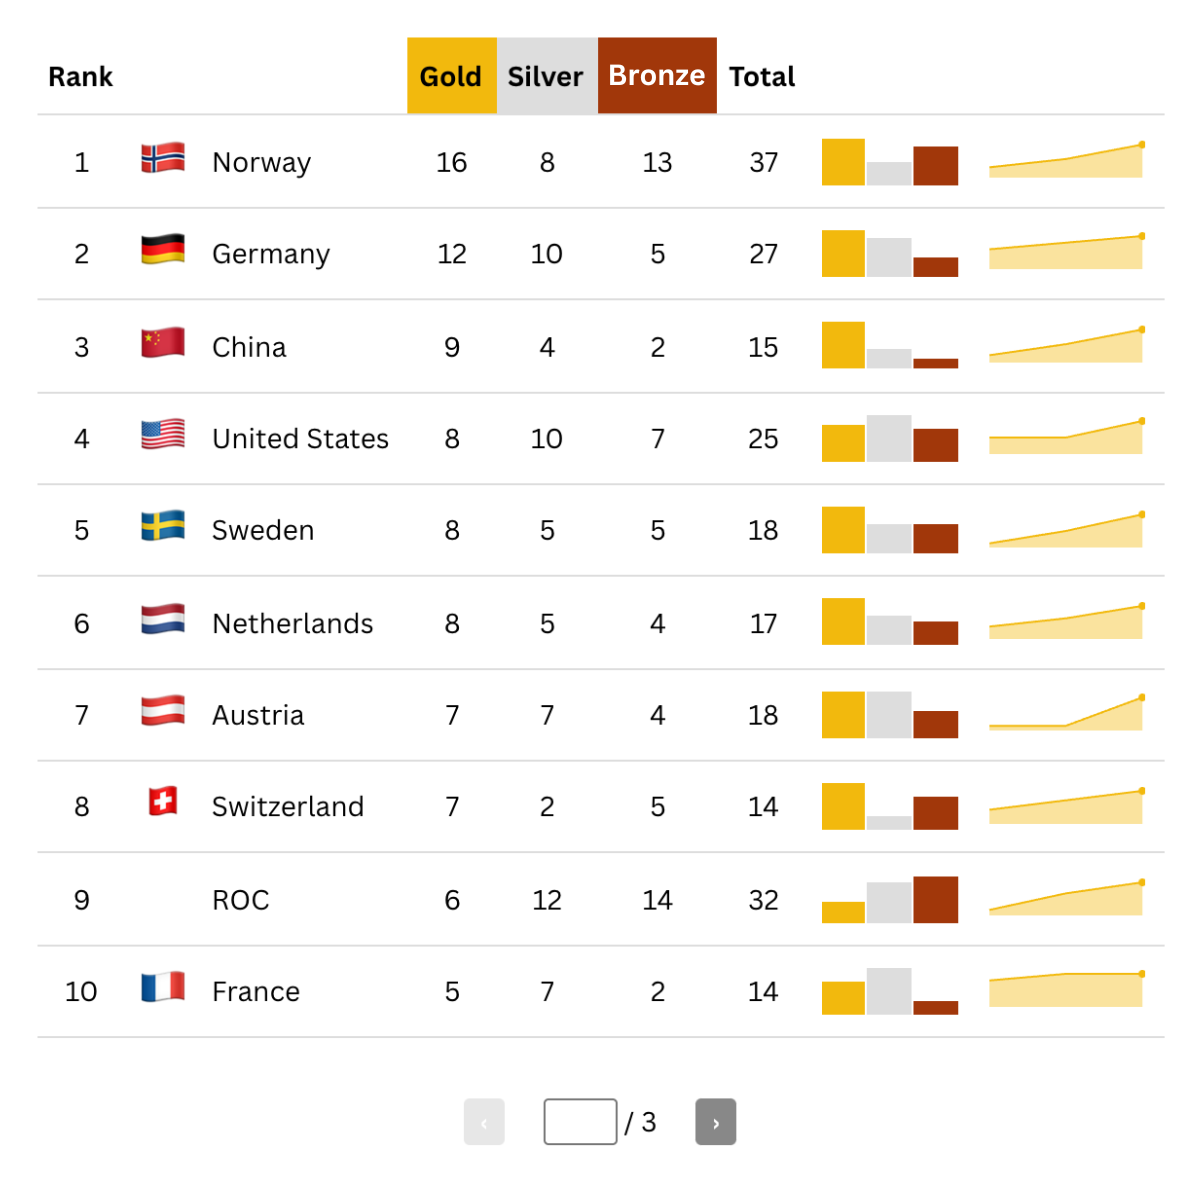
From data visualizations and interactive elements to immersive storytelling, Flourish empowers you to turn complex data into interactive visuals that wow your audience - whether you're an expert or just starting out.
Your data, fully interactive
Transform raw data into interactive visualizations that are as sleek as they are engaging. Say goodbye to static charts and let your audience explore, connect, and truly understand your story.
No-code creation, stunning results
Create professional-grade visuals in minutes — no coding, no hassle. Simply import your data and transform it into interactive visuals that grab attention. It's as easy as it gets.
Share anywhere, look great everywhere
Seamlessly share and embed your visualisations across platforms—websites, presentations, social media assets and more. Watch them adapt beautifully to any screen, captivating audiences across all devices.
Team up, stay on brand
Simplify collaboration and ensure your visuals stay polished and on-brand. Advanced sharing and customization options let your team create with confidence.
Flourish support is great: accessible, friendly, pursuing solutions for our eternal ‘exception of the rules’ queries to make visualizations work in our 40 languages.”
Roberto Belo-Rovella
Editor, BBC World Service
We live and breathe data, and no tool has enabled us to bring our data to life in a beautiful way better than Flourish has. It's a game changer.”
Joel Leeman
Sr. Executive Producer, London Stock Exchange

Let’s connect
Ready to transform your work with data storytelling? Connect with our team to learn more and get started today!
Get in touch- Ease of use: No specific technical skills are needed thanks to its template-based system and intuitive user interface.
- Storytelling: Flourish is uniquely designed to facilitate narrative visualizations, such as scrollytelling, interactive presentations, and audio-driven stories.
- Flexibility: The Flourish SDK lets developers create custom templates without limitations on functionality or design.
- Publishability: All outputs are styled for robustness, capable of reaching unlimited audiences, and optimized for mobile viewing.

